
Is a local brand you market under-performing, over-performing, or in line with industry averages on key reputation benchmarks? GatherUp analyzed 8,952 businesses across six major verticals to help you understand the competitive level you need to reach for a strong and influential reputation.
How is your online reputation influencing digital and real-world consumer behaviors? When a customer searches for you online, is what they encounter instilling enough trust in your brand to make it a top local choice? Compared to industry averages, is there more you could be doing to maximize the rankings and revenue that are powerfully driven by reviews?
Table of Contents
- How Influential Are Local Business Reviews?
- What Can You Expect from Active Review Acquisition?
- Customer Sentiment via Net Promoter Score (NPS)
- Growing Influence via Star Ratings
- Review Request Outcomes by Numbers and Methodologies: Email vs. SMS
- Frequently Asked Questions
- Final Thoughts: What These Reputation Benchmarks Mean for 2026
How Influential Are Local Business Reviews?
- 98% of consumers consult local business reviews before making a purchase
- 94% of consumers place some degree of trust in reviews
- 93% of consumers require a 3+ average star rating to consider a business
- 49% of consumers are spending more time reading reviews than they did a year ago
- 48% of consumers have used conversational AI to find local business information, and reputation content is a core feature of the outputs of environments like ChatGPT and Google AI Mode
- 45% of consumers give priority to the most recent review content
Source: Beyond the Stars 2025, GatherUp
It is hard to think of any form of online content that has earned a larger readership than local business reviews. Nearly all consumers consult them prior to a transaction. Potential customers use review metrics to conveniently evaluate your brand vs. local competitors, making an active approach to reputation management central to local search marketing strategies.
A professional reputation management program can contain multiple components, including but not limited to:
- First and third-party review acquisition via email, SMS, and other methodologies
- Review monitoring for instant notification of incoming reviews
- Prioritizing business owner response times to reviews to forge strong brand-consumer relations and resolve complaints to decrease customer churn and improve reputation metrics
- Review sentiment analysis over time to spot performance trends
- NPS surveys to gauge consumer satisfaction and the likelihood of referrals
- Review spam monitoring and reporting
- Review remarketing as an influential trust signal
- Competitive reputation analysis
All of these specialized tasks share the goal of maximizing your brand’s profits on the basis of earned rankings, trust, transactions, repeat sales, and referrals. The power of reviews to impact all of these areas is why they belong at the center of any local business marketing plan.
In this report, we’ll compare reputation metrics between 2023, 2024, and 2025 to establish benchmarks across the Healthcare, Insurance, Restaurant, Legal, Storage & Transportation, and Construction industries. How does your brand measure up?
What Can You Expect From Active Review Acquisition?
GatherUp analyzed nearly 9,000 businesses across six verticals to gauge the outcomes of their active review acquisition programs. In the following table, you’ll see YOY comparative data that measures the average review volumes of these businesses.
YOY Average Review Volumes Earned By Brands Requesting Reviews
| Industry | Avg. 1st Party Reviews (2023) | Avg. 1st Party Reviews (2024) | Avg. 1st Party Reviews (2025) | Avg. 3rd Party Reviews (2023) | Avg. 3rd Party Reviews (2024) | Avg. 3rd Party Reviews (2025) |
|---|---|---|---|---|---|---|
| Healthcare | 443 | 187 | 85 | 66 | 43 | 47 |
| Insurance | 49 | 150 | 36 | 11 | 32 | 33 |
| Restaurants | 327 | 162 | 80 | 63 | 137 | 163 |
| Legal & Law | 21 | 31 | 9 | 29 | 32 | 29 |
| Storage & Transportation | 140 | 144 | 73 | 94 | 60 | 75 |
| Construction | 37 | 39 | 27 | 29 | 60 | 52 |
Your Takeaways
As brands compete for the attention of busy and distracted consumers, many industries are experiencing a downtrend in earned first-party reviews (reviews gathered directly by the business from customers for publication). All verticals received fewer first-party reviews in 2025 vs. 2024.
Third-party reviews (reviews on platforms like Google Business Profiles/Maps and Yelp) are a more nuanced picture. Healthcare, insurance, storage & transportation, and restaurants saw increases over the previous year, but construction and legal saw slight downward movement.
A key takeaway here is that brands must work hard for every earned review. In scenarios of diminishing returns, your business should be sure every avenue is being explored to win customer feedback. Meanwhile, if your company is not currently investing in professional reputation management, it may quickly fall behind in a scenario in which online users have so many options for how to spend their free time on the internet.
Pro Tip
According to a separate consumer behavior survey by GatherUp, 67% of consumers are motivated to leave a review following an experience of great customer service; invest in perfecting how patrons are treated in person. 72% of consumers will respond to review requests at least some of the time; be sure you are asking every customer for their feedback. Finally, 77% of consumers prefer being asked for their review within 3 days of a transaction, but industry norms can vary. Run a month-over-month test in 2026 to gauge ideal review request timing.
Search and AI Visibility via First and Third-Party Reviews
The dynamic of online discoverability is rapidly altering due to the emergence of AI as a disruptive force in traditional consumer journeys. Now, consumers have the option of consulting both search and AI tools to discover local business reputation information. Reviews are playing a leading role across all environments. Consider the following examples:
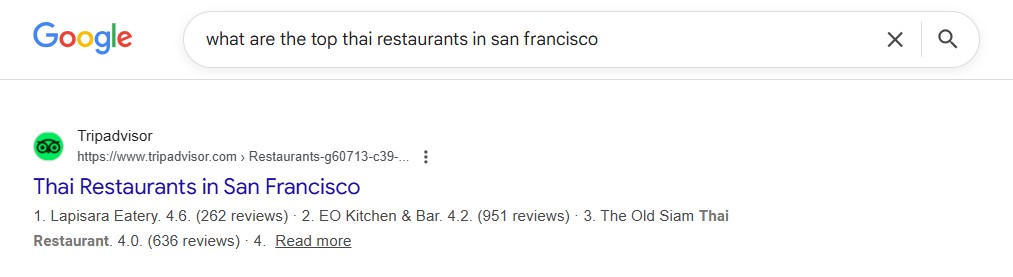
Reviews in organic search visibility
Searchers are continuing to encounter third-party review content featured highly in organic search engine results pages (SERPs) like this Tripadvisor entry.
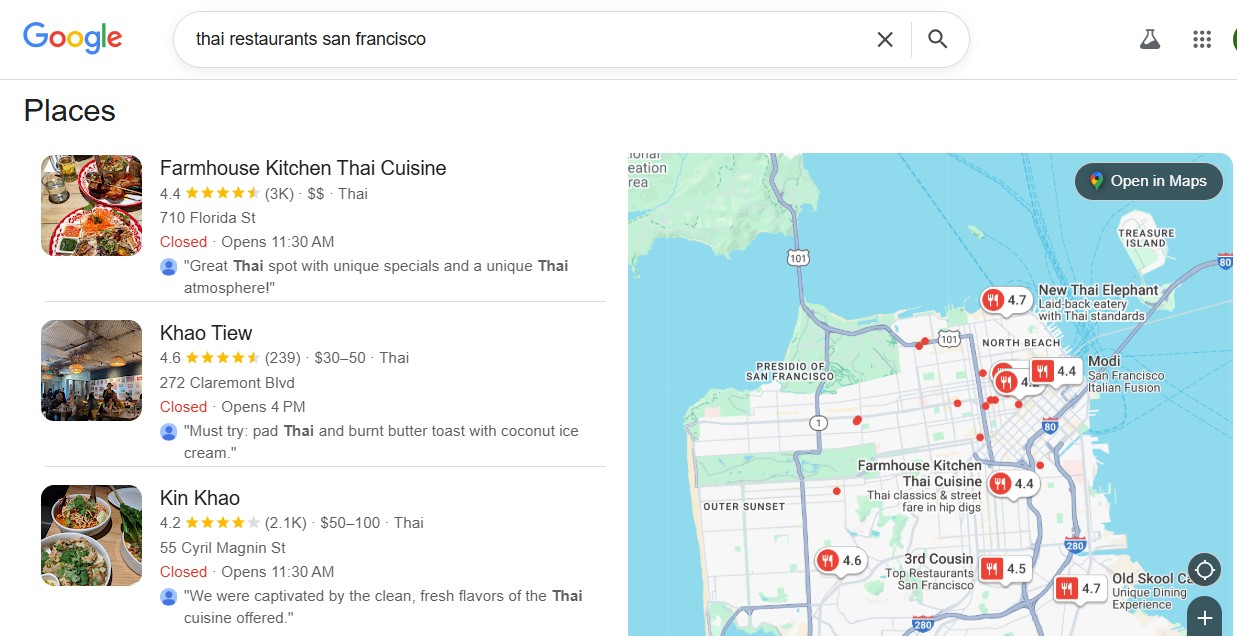
Reviews in local search visibility
Basic queries with a local intent continue to return Google local packs as the first item in many SERPs. Local packs can feature multiple reputation metrics including average star rating, review volume, and local justifications in the form of excerpts from reviews.
Reviews in AI summaries
Within Google’s organic SERPs, many local queries now receive an AI Overview, a summary generated in response to a search.
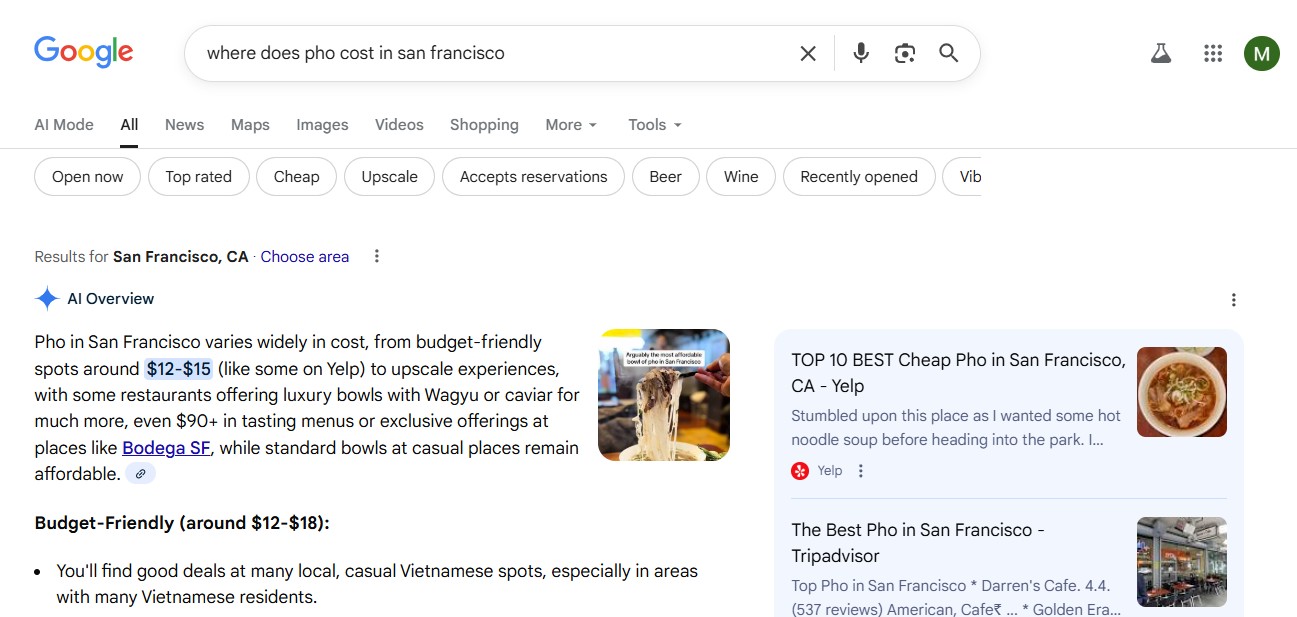
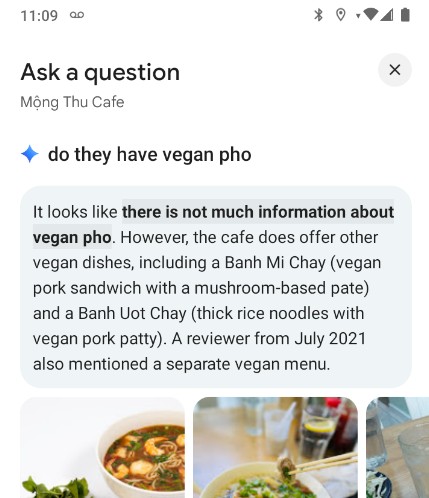
As the above screenshot shows, Google’s AI is scraping reputation platforms like Yelp to generate these results. Google is also heavily experimenting with AI-based review summaries in its Google Maps app results, including prompting users to ask questions about local businesses. As the following screenshot shows, Google is scraping its base of third-party reviews to respond to many of these new kinds of questions.
Reviews in conversational AI tools
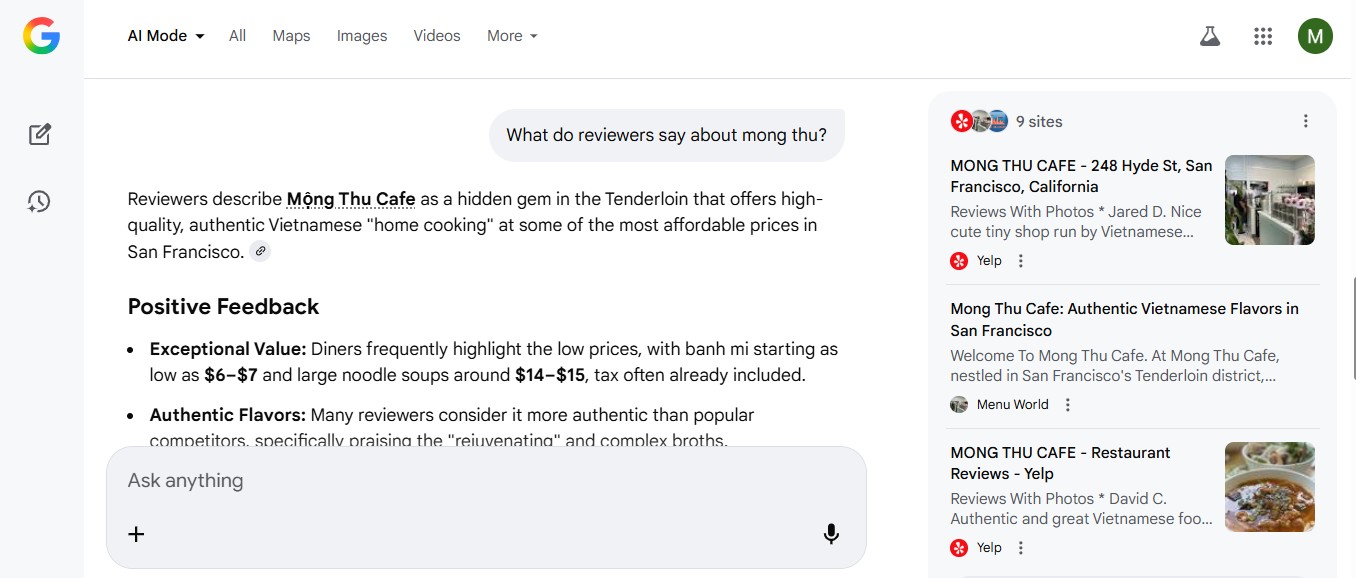
Finally, both first and third-party reviews are being scraped by tools like Google AI Mode and ChatGPT to generate content. A new marketing protocol is ensuring that your brand has developed a broad enough reputational footprint to give AI tools something to scrape and cite, to minimize the risk of them generating misinformation in response to the queries of potential customers.
Your reputation management program needs to include the acquisition of both first and third-party reviews to cover all your bases. Here are some notable features of both types of consumer-generated content:
First-party review benefits
- You have full control over the publication of reviews and testimonials gathered directly from your customers; unlike third-party reviews, they cannot be lost, filtered out or removed.
- In-person requests for first-party reviews provide a unique and comfortable opportunity for asking specific customers to leave highly detailed feedback; this content can be scraped by AI to generate answers to very granular questions.
Third-party review benefits
- Google reviews, in particular, are being used to fuel multiple aspects of their local search and AI-generated results; Google’s dominance makes your reviews highly discoverable in local consumer journeys.
- Consumers have adopted the habit of using third-party review platforms to leave feedback without being asked; this activity can greatly contribute to your overall review metrics, including average star rating, recency, and volume.
First-party reviews can make your website, social media, and other owned media more helpful to potential customers because they encounter both proof that your business is trusted by the community and content detailing specific aspects of your business.
Third-party reviews directly impact Google local pack rankings. The 2026 Whitespark Local Search Ranking Factors Survey finds that 20% of the factors that influence visibility in local packs and Maps relate to reviews.
Meanwhile, AI is ushering in a new era in which local business marketers must feed reputation content to new tools and platforms to ensure brands are abundantly represented in generated outputs.
Customer Sentiment via Net Promoter Score (NPS)
Net Promoter Score (NPS) is a beautifully simple reputation evaluation metric. It consists of asking consumers a single question: how likely are you to recommend this business to others?
NPS is considered a reliable measure of customer satisfaction as well as a good predictor of long-term business success in terms of revenue growth and recurrent transactions.
At a glance, here’s how to read NPS:
- 0 and above = good
- 20 and above = favorable
- 50 and above = excellent
- 80 and above = world-class
YOY Average NPS
| Industry | NPS 2024 | NPS 2025 | Point Difference |
|---|---|---|---|
| Healthcare | 87 | 35 | -52 |
| Insurance | 88 | 19 | -69 |
| Restaurants | 75 | 31 | -44 |
| Legal & Law | 85 | 20 | -65 |
| Storage & Transportation | 66 | 45 | -21 |
| Construction | 87 | 27 | -60 |
Understanding the 2025 NPS Decline: Broader Forces at Play
The significant year-over-year decline in Net Promoter Scores across every vertical in this report calls for interpretation beyond brand-level performance alone. When every industry moves sharply in the same direction, the pattern suggests broader behavioral forces may be influencing recommendation behavior in 2025.
What This Likely Signals: A Shift in Endorsement Behavior
Net Promoter Score measures willingness to recommend. It captures more than satisfaction. It captures advocacy.
In periods of economic optimism, consumers tend to recommend more freely. In periods of financial uncertainty, endorsement behavior often becomes more conservative.
Recent data from the University of Michigan shows notable year-over-year weakness in consumer sentiment in 2025 compared to 2024, including lower readings in mid-2025 versus the prior year. When confidence softens, customers may continue to transact, but they become more selective about who they publicly “vouch” for.
This broader mood shift may partially explain why every vertical in this survey experienced meaningful NPS declines simultaneously. The data suggests a rising threshold for advocacy, not necessarily a collapse in customer satisfaction.
For brands, this distinction is critical. NPS measures enthusiasm. In a cautious economic climate, enthusiasm requires more reinforcement.
Insurance as a Leading Indicator
Insurance experienced the steepest decline, dropping from 88 to 19. This movement aligns with documented premium increases and growing consumer sensitivity around affordability and coverage.
J.D. Power has reported widespread homeowners insurance premium increases and links those increases to elevated defection risk. Broader reporting highlights frustration tied to rising costs and perceived coverage gaps.
In this environment, NPS may be reflecting price pressure and fairness perceptions more than frontline service quality. Customers may value their representative while still feeling strained by rate increases or claims friction. When financial pressure rises, recommendation behavior often tightens.
Insurance may therefore function as a leading indicator of how affordability dynamics can influence advocacy across high-cost industries.
A Pattern Across High-Cost, High-Trust Categories
The steepest NPS declines cluster in industries where consumers experience one or more of the following:
- High financial commitment
- Limited perceived control
- Complex service outcomes
- Elevated trust requirements
Healthcare, legal, construction, and insurance all fit this profile. In such categories, economic sensitivity can heighten scrutiny. Customers may remain satisfied, yet become less inclined to recommend unless they feel clear value, fairness, and confidence.
By contrast, more standardized or transactional categories show comparatively smaller shifts.
This clustering reinforces the idea that 2025 NPS declines are not random. They align with the broader consumer environment.
Interpreting the Data Responsibly
Because declines occurred across every segment, part of the movement likely reflects behavioral context in addition to brand-level factors. Survey research consistently demonstrates that shifts in response rates, distribution timing, and consumer sentiment can influence outcomes.
For brands benchmarking against these figures, the goal is not alarm, but interpretation.
If your NPS declined in 2025, you are operating within a broader environment in which consumers appear more conservative with endorsements. The strategic question becomes:
“How do we reinforce confidence in a climate where advocacy thresholds are rising?”
What This Means for Brands
In a cautious economic cycle, earning a recommendation requires more than meeting expectations. It requires clarity, fairness, and visible value.
Brands that proactively manage customer feedback, address friction quickly, and reinforce transparency are better positioned to stabilize advocacy during periods of sentiment volatility.
GatherUp finds that 55% of consumers trust what customers say about brands over what brands say about themselves. So the 2025 NPS downturn does not suggest that consumers have disengaged from local businesses. It suggests that the bar for recommendation has moved higher.
Understanding that shift allows brands to respond strategically rather than reactively.
Growing Influence via Star Ratings
Average star ratings provide consumers with a useful shorthand metric for judging customer satisfaction at a business in comparison to local competitors. These ratings also impact Google local pack rankings, thereby influencing discoverability, conversions, and sales.
In the following table, GatherUp calculates the gains made in 2025 by brands that actively requested reviews. Numbers have been rounded for ease of comprehension.
YOY Star Rating Gains Resulting from Active Review Acquisition
| Industry | Stars Before Requests (2024) | Stars After Requests (2024) | Stars Before Requests (2025) | Stars After Requests (2025) |
|---|---|---|---|---|
| Healthcare | 4.6 | 4.6 | 3.9 | 4.1 |
| Insurance | 4.5 | 4.5 | 4.1 | 4.1 |
| Restaurants | 4.2 | 4.3 | 3.8 | 4.0 |
| Legal & Law | 4.7 | 4.7 | 4.0 | 4.3 |
| Storage & Transportation | 4.2 | 4.2 | 3.9 | 4.0 |
| Construction | 4.7 | 4.7 | 3.8 | 4.1 |
Across the board, active review requests had measurable positive outcomes on average star ratings. Even in the insurance category, actual numbers showed a small gain from 4.10 to 4.18. Elsewhere, gains were more meaningful. Legal and construction are the biggest winners, and any vertical moving out of 3-star territory into 4-star territory should expect to see an increase in real-world metrics like calls and sales.
Your Takeaways
Average star ratings are worth obsessing over because of their demonstrable impact on local consumer behaviors. In a survey of 1,000+ US-based consumers, GatherUp finds that:
- 18% of potential customers demand a perfect 5-star rating in order to choose a business for a transaction
- 24% require a 4.5 average rating
- 37% require a 4-star or higher rating
- 13% cite 3 stars as their threshold
- Only 1% will select a business with a 2-star rating
The main learning from the above chart is that active review acquisition favorably impacts YOY star ratings. These are figures we recommend sharing with decision makers at the brands you are tasked with marketing. The pursuit of rating improvements is worthwhile because of its strong link to profitability.
Review Request Outcomes By Numbers and Methodologies: Email vs. SMS
The following table benchmarks average first-party and third-party reviews earned per volume of requests by industry. You’ll also see a calculation of average reviews earned per 100 requests. Numbers have been rounded for ease of comprehension.
| Industry | Average requests sent | Earned first-party reviews | Earned third-party reviews | Total reviews per 100 requests | First-party per 100 | Third-party per 100 |
|---|---|---|---|---|---|---|
| Healthcare | 833 | 85 | 47 | 16 | 10 | 6 |
| Construction | 163 | 27 | 52 | 50 | 17 | 33 |
| Storage & Transportation | 601 | 73 | 75 | 25 | 12 | 13 |
| Restaurants | 1,546 | 80 | 163 | 16 | 5 | 11 |
| Legal & Law | 82 | 9 | 30 | 49* | 11* | 38* |
| Insurance | 304 | 36 | 33 | 23 | 12 | 11 |
The following table charts average reviews earned across all industries per 100 requests based on brands using SMS only, email only, and a combination of SMS + email:
| Request Method | Earned Reviews per 100 Requests (2023) | Earned Reviews per 100 Requests (2024) | Earned Reviews per 100 Requests (2025) |
|---|---|---|---|
| SMS Only | 20.1 | 14.2 | 11.8 |
| Email Only | 15.1 | 12.2 | 12.9 |
| SMS + Email | 14.9 | 14.0 | 13.5 |
Understanding the 2023–2025 Decline in Email & SMS Response Rates
Response rates declined across all delivery methods between 2023 and 2025. This trend is consistent with broader industry shifts and is not isolated to this dataset.
Email Deliverability Tightened
Beginning in February 2024, Google and Yahoo introduced stricter bulk sender authentication requirements, with Google escalating to permanent rejection of non-compliant senders by late 2025. Microsoft followed with similar enforcement in 2025. Brands without proper SPF, DKIM, and DMARC authentication saw messages increasingly routed to spam or blocked entirely, often without notice. The drop in email-channel performance between 2023 and 2024 closely aligns with this regulatory tightening.
SMS Trust Has Eroded
At the same time, consumer caution around text-based links increased. Americans received approximately 19.2 billion spam texts in a single month in early 2025, and reported losses from text scams reached $470 million in 2024, more than five times the 2020 total. Industry benchmarks show SMS click-through rates declining from roughly 8% in 2023 to 6% in 2024. As spam volume and carrier filtering increased, consumer hesitation followed. The SMS-only decline reflected in this dataset mirrors that broader trend.
More Requests, Limited Attention
Outbound volume also rose. Businesses sent approximately 25% more review requests in 2024 than in 2023, contributing to message fatigue. At the same time, broad email outreach studies report reply rates falling approximately 15% year-over-year in 2024, with inbox placement rates for bulk senders dropping more than 22 percentage points between Q1 2024 and Q1 2025. Against this backdrop, the declines observed here are comparatively modest.
What This Means for Brands
The 2023–2025 decline does not suggest that customers are unwilling to leave reviews. It reflects a more complex and restrictive messaging environment.
As inbox providers and carriers tighten standards, performance depends less on volume and more on precision. Brands can strengthen response rates by ensuring proper email authentication (SPF, DKIM, DMARC), actively monitoring deliverability health, and auditing spam placement regularly. Optimizing send timing based on customer behavior, reducing redundant requests, and personalizing outreach can also improve engagement in a crowded inbox.
For SMS, recognizable sender identification, clear brand context in the opening line, and limiting link-heavy messaging can help rebuild trust in an environment shaped by spam fatigue. Pairing digital requests with in-person prompts or staff reinforcement can further increase completion rates.
Finally, diversification matters. Balancing first- and third-party review acquisition, testing channel mix performance, and adjusting cadence based on response data ensures brands are not over-reliant on any single delivery method.
In a tighter ecosystem, smarter sending consistently outperforms louder sending. GatherUp’s role is to help brands operationalize these best practices so that compliance, deliverability, and strategy work together to offset external market pressures.
For a deeper dive into tactical execution, read our guide to building a review engine that runs itself.
Frequently Asked Questions
How many reviews does a business earn per 100 review requests?
In 2025, businesses earned 11.8 reviews per 100 requests with SMS only, 12.9 with email only, and 13.5 with both combined. By industry, construction earned the most (about 50 per 100) and healthcare and restaurants the fewest (about 16).
Is SMS or email better for review requests?
Using both works best. SMS alone led in 2023 at 20.1 reviews per 100 requests, then fell to 11.8 by 2025 as spam texts and carrier filtering grew. Email recovered to 12.9 in 2025. The combination has been the most consistent performer across all three years.
Do review requests improve star ratings?
Yes. In 2025, every industry that actively requested reviews held or raised its average rating. Legal rose from 4.0 to 4.3 and construction from 3.8 to 4.1.
What is a good Net Promoter Score?
Above 0 is good, 20 and above is favorable, 50 and above is excellent, and 80 and above is world-class. In 2025, industry averages ranged from 19 (insurance) to 45 (storage and transportation).
Final Thoughts: What These Reputation Benchmarks Mean for 2026
Response rates are declining across every delivery method and every channel, but the data tells a more nuanced story than a simple downward trend. Email is recovering. Multi-channel senders consistently outperform single-channel ones. And the brands that will pull ahead in 2026 aren’t the ones sending the most review requests; they’re the ones sending the right requests, through the right channels, to the right customers at the right time.
The external headwinds are real. Tightening deliverability standards, rising SMS spam, and growing consumer fatigue are forces no platform can eliminate. But they are forces you can navigate, and the gap between brands that navigate them well and brands that don’t is measurable in both response rates and revenue.
The data points to three actions that will move the needle today:
1. Add email to your SMS strategy or SMS to your email strategy. Multi-channel senders outperformed single-channel senders in every year measured. If you’re only using one channel, you’re leaving responses on the table. The lift from adding a second channel isn’t marginal, it’s structural.
2. Audit your email authentication before your next send. Google, Yahoo, and Microsoft have all tightened bulk sender requirements between 2024 and 2026. If your review request emails aren’t properly authenticated with SPF, DKIM, and DMARC, a meaningful percentage of them are landing in spam or being rejected entirely with no notification to you. Fix this once and it pays dividends on every send going forward.
3. Prioritize timing and relevance over volume. Businesses sent 25% more review requests in 2024 and got lower response rates for it. More requests isn’t the answer. Requests sent at the right moment in the customer journey — close to the transaction, personalized, and through the customer’s preferred channel — consistently outperform high-volume, low-context blasts.
GatherUp is built specifically to help businesses execute on all three. Multi-channel request flows, deliverability best practices baked into the platform, and automated send timing ensure your review requests reach customers when they’re most likely to respond, not when it’s most convenient to send.
Ready to see where your strategy stands?
The benchmarks in this report are only useful if you know how you measure up against them. GatherUp’s free reputation audit gives you a personalized look at your current response rates by channel, flags any deliverability gaps that may be suppressing your results, and shows you exactly where your biggest opportunities for improvement are in 2026.
Schedule a free reputation audit with GatherUp. It takes less than 15 minutes and costs nothing. The brands that act on data like this are the ones that show up in more searches, earn more trust, and win more customers.
Get next year’s benchmarks before your competitors do. Follow GatherUp on LinkedIn or subscribe to our blog.
Net Promoter®, NPS®, and the NPS-related emoticons are registered trademarks of Bain & Company, Inc., NICE Systems, Inc., and Fred Reichheld. Net Promoter Score℠ and Net Promoter System℠ are service marks of Bain & Company, Inc., NICE Systems, Inc., and Fred Reichheld.