It’s a business intelligence gift when data challenges your biases about consumer behavior. Today, we’re taking 10 of the questions from our recent major survey, Beyond the Stars: How American Consumers Use Reviews to Choose Local Businesses and breaking the responses down by age group. Each data point will be labeled as either a surprise, or not a surprise, based on the hypotheses I formed prior to examining the demographic breakdown.
This is the first part of a three-part blog series exploring the results of the survey.
- Part two: The Leading Characteristics of Local Business Review Readers
- Part three: The Leading Characteristics of Local Business Review Writers
I can almost guarantee, you’ll share my surprise on a few of these takeaways, and I hope that what you learn will help you in the serious work of reputation management for the local brands you market. The better you know your customers’ preferences and habits, the better you can serve them.
GatherUp’s survey polled 1,200+ American consumers, and all numbers in this article have been rounded up for ease of reading.
1. Surprise: Oldest consumers are not the most wary of reviews
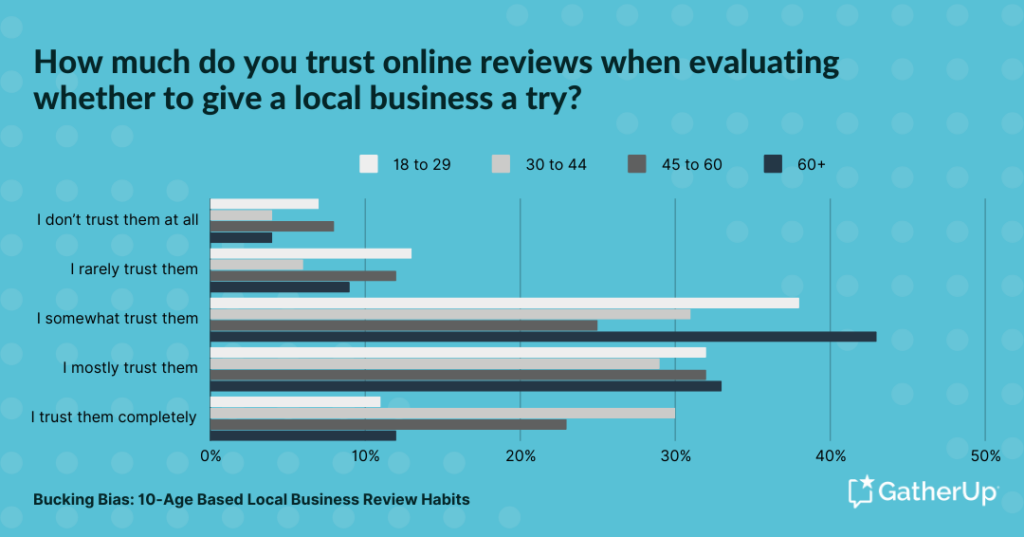
I hypothesized that the oldest consumers would feel the least trust in local business reviews, due to a lifetime of earned skepticism. I felt that older consumers have had the most time to become aware of the problems with review spam. They say that with age comes wisdom, but the data has proved me (and perhaps this axiom) wrong:
It isn’t the 60+ group with the highest percentage of not trusting reviews at all: it’s the 45-60 year-olds coming in at 8% in this category. Meanwhile, 13% of 18-29 year-olds are the dominant group when it comes to rarely trusting reviews, challenging any bias which suggests that youth can be equated with gullibility. While both percentages are minor, they do indicate that if a large portion of your customers fall within these demographics, you may need to work harder to prove authenticity and earn trust. Interestingly, the group most heavily characterized by complete trust in reviews (30%) is 30-44 year-olds, but this number is also small and is indicative of the reality that a minority of internet users totally trust the reputational content they encounter online.
2. Surprise: Youngest consumers are not the heaviest users of AI tools like ChatGPT when looking for local business info
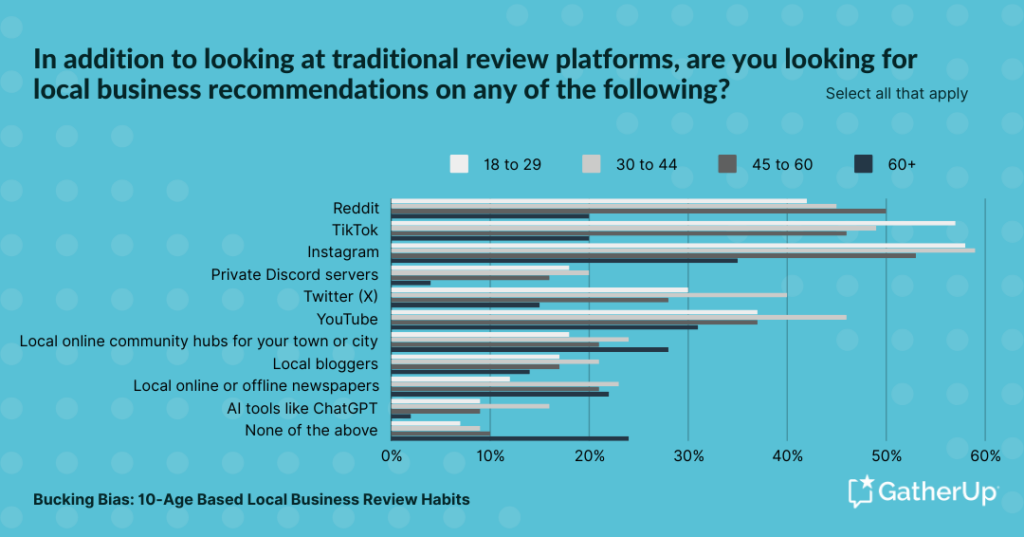
I hypothesized that the 18-29 year-old group would be the strongest adopters of AI tools like ChatGPT when seeking local business information, but that distinction actually falls to 30-44 year-olds (16%):
This question yielded a treasure-trove of demographic data about the use of social media and other platforms for discovering local business information beyond traditional review platforms. For example, I incorrectly predicted that the youngest users would make up the Reddit crowd, when, in fact, this falls to 45-60 year-olds (50%). I was correct about TikTok being the preference of 18-29 year-olds (60%), but every other category was dominated by older users. This challenges any mental bias we may have about social media being for “kids”, and a study of the full data in the above chart should help your brand better understand where its customers are seeking local business information. It’s worth noting how little adoption yet exists for AI offerings, despite multi-billion dollar funding and wall-to-wall advertising campaigns.
3. No surprise: Oldest consumers read the most reviews before forming an opinion about a business
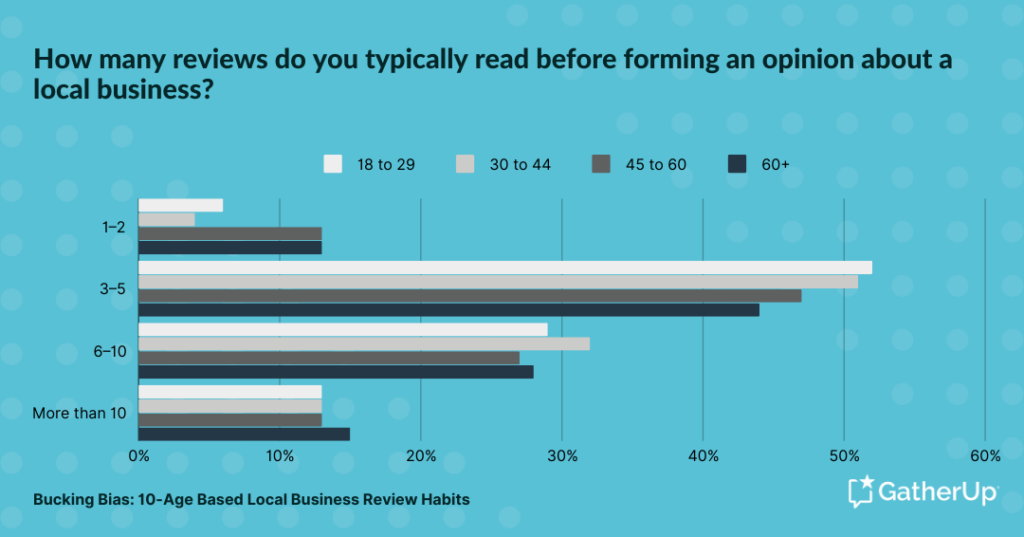
The finding that 60+ year-olds are the dominant group (15%) reading 10+ reviews before forming an opinion of a local business confirmed my hypothesis:
However, I was surprised that the dominant group reading 6-10 reviews was not the next oldest demographic; instead, that distinction falls to 30-44 year-olds (32%). I was surprised that 45-60 year-olds and 60+ year-olds are tied at 13% in reading just 1-2 reviews, and that they are surpassed in willingness to read by 52% of 18-29 year-olds who read 3-5 reviews before feeling they understand a local business’ reputation. If the majority of your customer base is made up of the most mature customers, you will need to ensure that your local business profiles offer plenty of review content for their perusal.
4. Surprise: Youngest consumers are the most likely to accept a 1-star business
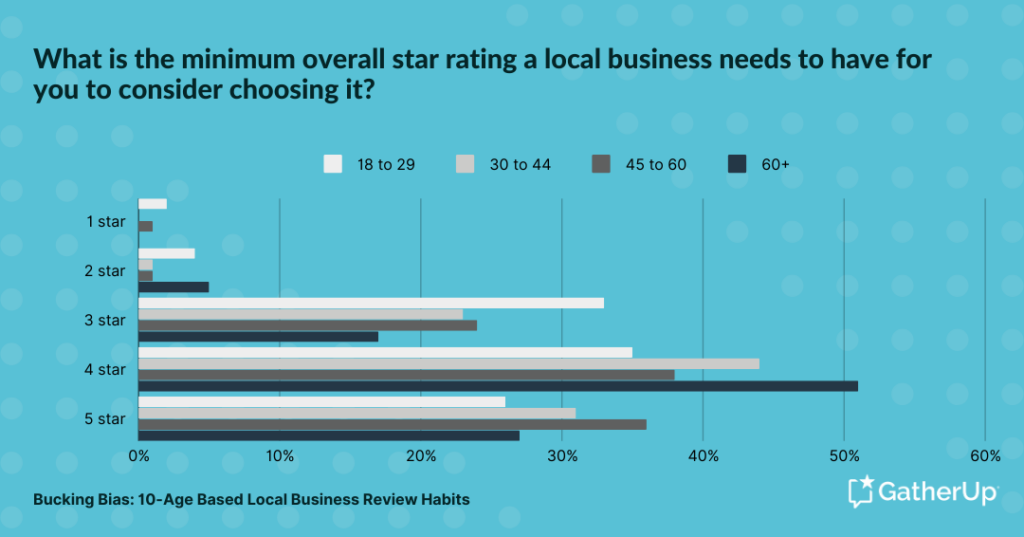
I wrongly hypothesized that youthful idealism would cause 18-29 year-olds to insist on 5-star ratings when considering whether to choose a local business. In fact, they are the dominant group (2%) who will accept a 1-star business, while it is the 45-60 year-olds who insist on a 5-star rating (36%):
I was, however, correct in guessing that older consumers would be satisfied with a 4-star rating, due to a lifetime of having to make compromises with imperfection. This category is dominated by 60+ year-olds (51%), 18-29 year-olds are the dominant group for a minimum overall star rating of 1 (2%), but 18-29 year-olds lead the pack when it comes to accepting 3-star ratings (33%). Overall, the percentage of consumers who won’t consider a business with a less-than-five-star rating is small, and this should be encouraging to any brand that receives a few, inevitable negative reviews.
5. No surprise: Youngest consumers’ trust is the least impacted by knowing review responses may be AI-generated
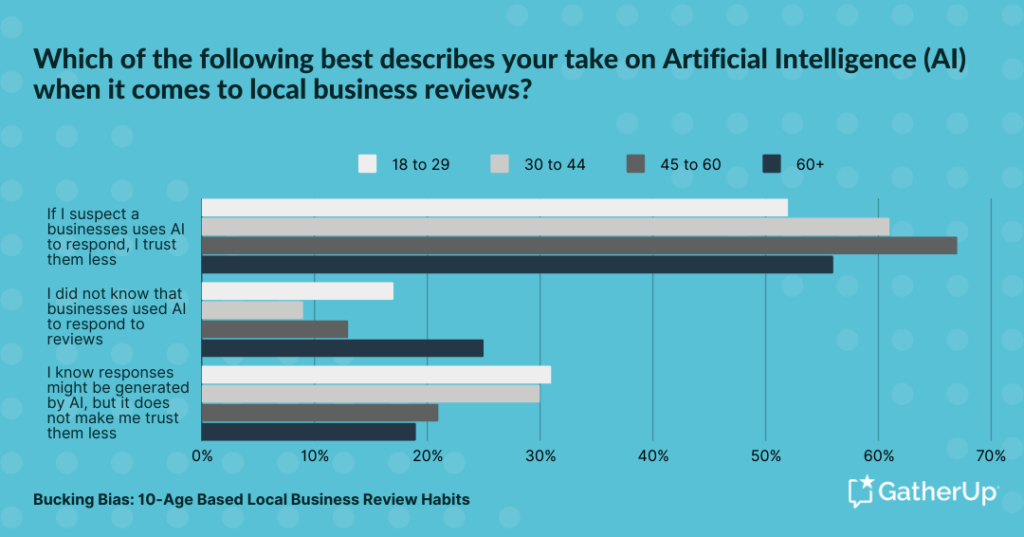
It’s a trend I don’t like, but I correctly theorized that 18-29 year-olds would be the group stating that the presence of AI-generated owner responses to reviews does not change the level of trust they feel in local businesses (31%). Young people are continuously inundated with fast-paced technological change, and there is a serious risk here of brands offering ever-lower quality customer experiences to the young in the belief that they can get away with it. However, it’s important to note that 31% is only about ⅓ of this group, and it would be very risky to assume that customers in any of the following groups welcome being “handled” by AI, rather than served by well-trained staff:
45-60 year-olds are the dominant group (67%) who will lose trust in your brand if they suspect you are using AI to respond to reviews, and 60+ year-olds are the most likely to be unaware that AI may be employed to write responses (25%). Great care should be taken by mindful brands not to lose consumer trust over fads, even those promising cost-cutting and efficiency.
6. No surprise: Older consumers write the most Google reviews
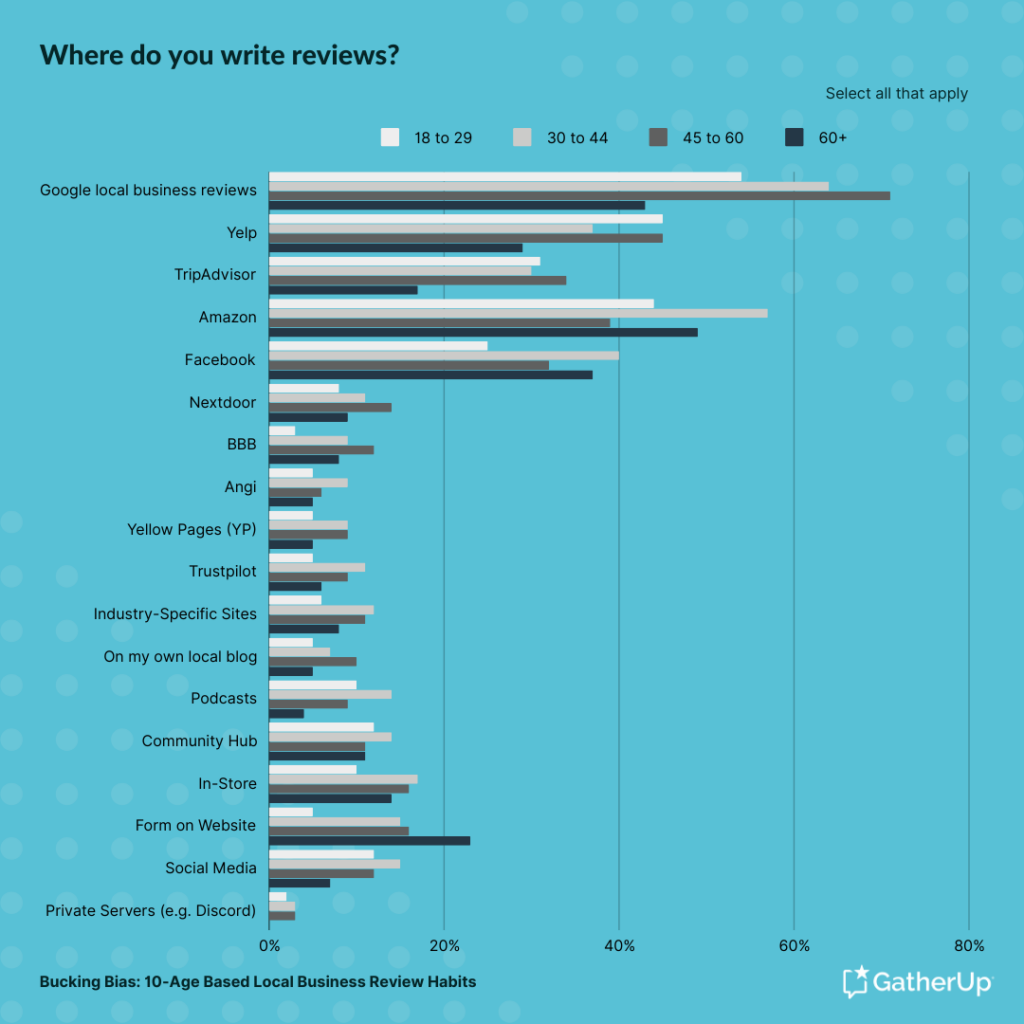
I hypothesized that Google would be a more popular destination for writing reviews with the older crowd, and it turns out that the group dominating this category are 45-60 year-olds (71%):
When looking at this wealth of information as a whole, 30-44 year-olds emerge as the dominant group in review writing across multiple platforms, including Facebook, Amazon, Angi, Trustpilot, Yellow Pages, industry-specific websites, town or city online community hubs, and in-store feedback forms/suggestion boxes. This group is highly active, and your brand wants to earn their engagement.
Study the above chart carefully to find alignment between your core consumer base and the diversity of preferences expressed about where people of different ages are recommending local businesses. Your brand may discover that it is time to investigate podcasts, Discord servers, or specific social media platforms.
7. Surprise: Email-based review requests are popular across most age groups
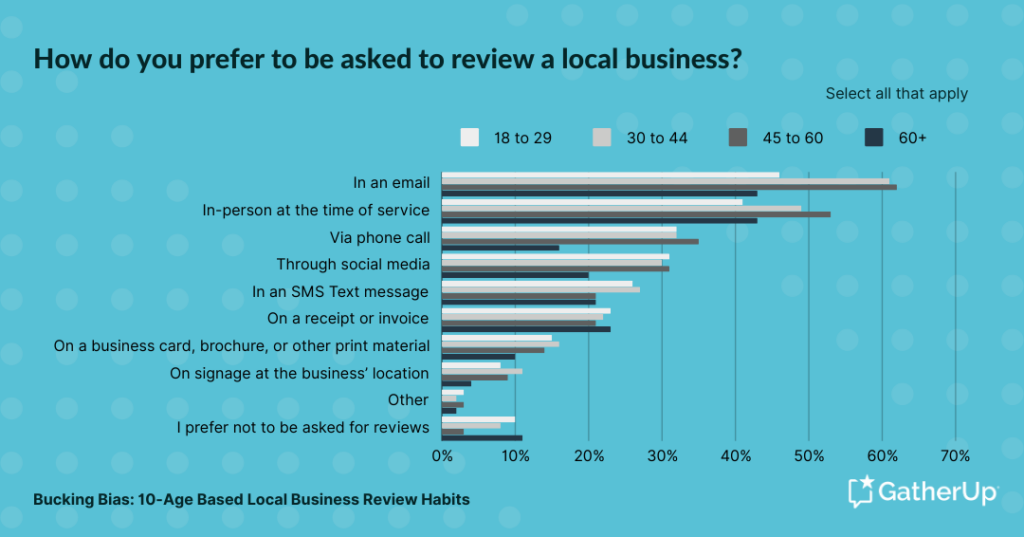
I hypothesized that email-based review requests would be the most popular with our 60+ group, and the least popular with 18-29 year-olds. I was wrong. 46% of our youngest respondents prefer review requests via email vs. 43% of the 60+ group. 45-60 year-olds express the most preference for this review request format (62%), with the 31-44 year-olds close on their heels at 61%. Across the board, email-based review requests are the most popular, regardless of demographic, and only tied with in-person requests at the time of service in the 60+ category:
SMS-based review requests do not fare as well as I might have thought, failing to break 30% in any age group as a preferred outreach methodology. However, having just gone through a political cycle in the United States in which my phone was continuously spammed with unsolicited donation requests, there is a chance that American respondents are not currently feeling very welcoming towards additional texts coming in on their phones. However, none of these numbers should discourage your brand from requesting reviews across multiple media, especially when taken in conjunction with the recent finding by GatherUp that a combination of email and SMS review requests can significantly boost conversions.
8. Surprise: Youngest consumers are the least influenced by the presence of owner responses
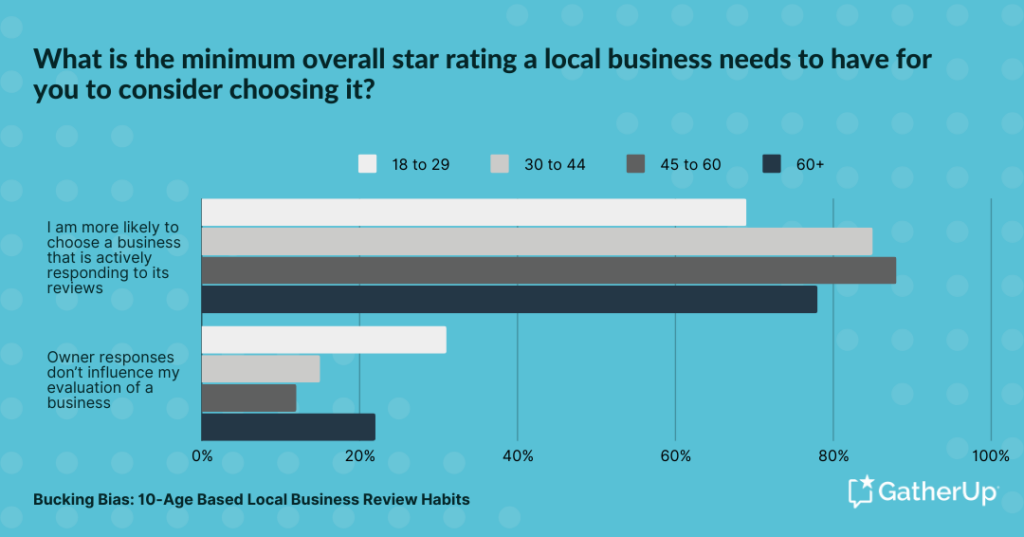
Given the incursions of social media into the lives of the young, I hypothesized that the interactive quality of owner responses to local business reviews would have the most appeal to the 18-29 year-old group. I was wrong. This turned out to be the dominant set (31%) stating that owner responses don’t influence their evaluation of a business. Instead, 81% of 45-60 year-olds are most likely to choose a business that is actively responding to its reviews:
While it may be that the young are most inclined to seek online interactivity from places other than owner responses, the dominant trend across the board is that this form of content has a massive impact on whether your business is chosen. A look at the numbers confirms that your brand would be wise to invest significantly in responding to every consumer who writes to you via a review.
9. Surprise: Youngest consumers don’t demand the fastest response times
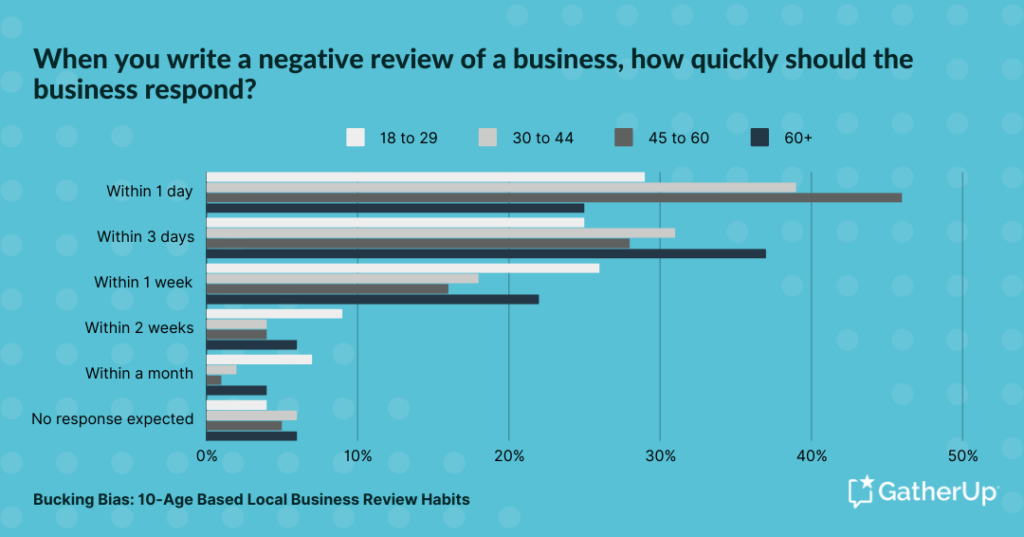
Given that the youngest consumers have lived their whole lives within an increasingly-automated internet age, I hypothesized that they might have the least patience with review response times. I couldn’t have been more wrong! 18-29 year-olds lead the pack in expressing that a business should be fine if it is taking one week, two weeks, or even a month to reply to its reviews. However, it should be noted that the percentages are quite small, and regardless of age, the expectations of all groups tend to be less lax than this:
45-60 year-olds are the dominant group (46%) expecting a response within one day, while 60+ year-olds (37%) extend that period to three days. As the numbers indicate, most of your customers are expecting a response in a timely fashion, with a tiny percentage of any demographic expecting no response at all.
10. Surprise: Youngest consumers experience the most increased loyalty to brands that respond to negative reviews
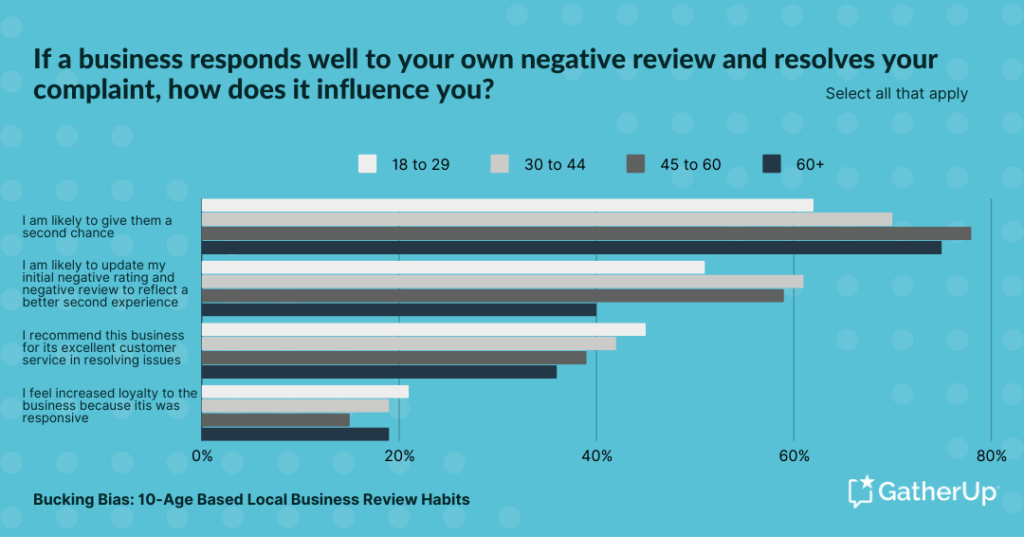
My hypothesis was that all four sentiments associated with this survey question would skew highest with our older respondents. I felt that lived experience might help more mature consumers be more open to compromise, mediation, and resolution. While I was right on some points, I was surprised that the dominant group feeling more loyalty when a business responds when something has gone wrong is the 18-29 year-olds (21%):
The vital takeaway from this data set is the significant power of owner responses to win back unhappy customers, achieve improvement in negative reviews and ratings, earn recommendations, and even increase loyalty. Though the numbers vary by degree amongst the different demographics, there is a clear trend here that investment in resolving complaints cited in negative reviews is time well spent.
In Conclusion
Everyone has biases. Sometimes, they can get in the way of effective local business marketing when not fact-checked against available data. There are few tasks more important for local brands than getting to know the preferences and habits of their own unique customer base. I hope that this demographic breakdown has been a useful stepping stone to gains in providing an exceptional customer experience. I encourage you to follow up with a perusal of the full report, which offers a great deal of very valuable insight, and to consider whether there are polls and surveys your own business might conduct to build even better relationships with the community you serve.
To learn how GatherUp’s reputation management platform can support your insurance business, request a consultation with one of our reputation experts today.

