Finding, tracking and collating Key Performance Indicators (KPIs)* that demonstrate the performance of your online efforts has always been difficult in the local digital marketing space. But with upgrades in reporting at Google, Yelp and a newly minted web site, I took the opportunity to do just that in a case study with our favorite “guinea pig” Barbara Oliver Jewelry from the Buffalo, NY area.

Not only were we able to create a credible view of the drivers of her local business we were able to implement an in-store survey so as to be able to ascribe attribution to both her online and offline marketing efforts which we discuss in part 2 of this series.
What Is The Diamond Of Local Digital Marketing?
Barbara Oliver Jewelry created a new website last August 2016 and hired a new staffer to help with marketing. She has had an active presence on Facebook, has been doing review management with good success since 2009 , is running a very small Google Adwords Express campaign and starting last June started an active Google+ campaign.
She does have a Yext account (provided gratis by Yext) as well and a verified Yelp presence but has never advertised there.
Her high end jewelry store is located on the 3rd floor of an office building with zero walk in traffic and no street side presence. Her advertising budget is limited to a few key areas. Most money is spent on radio, some on a billboard, less on G+ and search optimization. She has been spending about the same on the Yellow Pages per quarter as on SEO. A tiny amount per quarter on Facebook boosts and GetFiveStars. Thus her potential sources of new customers are relatively clean and defined.
The last quarter of 2016 was a good time to implement a study of her KPIs and attempt to glean attribution via an in-store survey.
Local Digital Marketing KPIs
We wanted to explore the “low on the funnel” performance indicators and understand their relationship to new customer acquisition and purchases. Obviously there are many KPIs from which to choose. We identified the following as the digital components that were trackable and, given that there was no e-commerce component on her site, as close as we could get to the purchase*.
- Contact form fill
- FB messaging and comments expressing intent
- Clicks to call
- Request for driving directions
They were, in her case, the best indicators of intent.
With the new website we were sure to put in place event tracking for contact form fills, click to call actions and driving directions requests. For additional sources of this information we looked at dashboards at Yelp, Bing, Google, indexed all comments that showed intent at FB and tracked all of these in addition to those events on her website. While she has a Yext dashboard as well, they do not track any of these metrics from the websites that they post on.
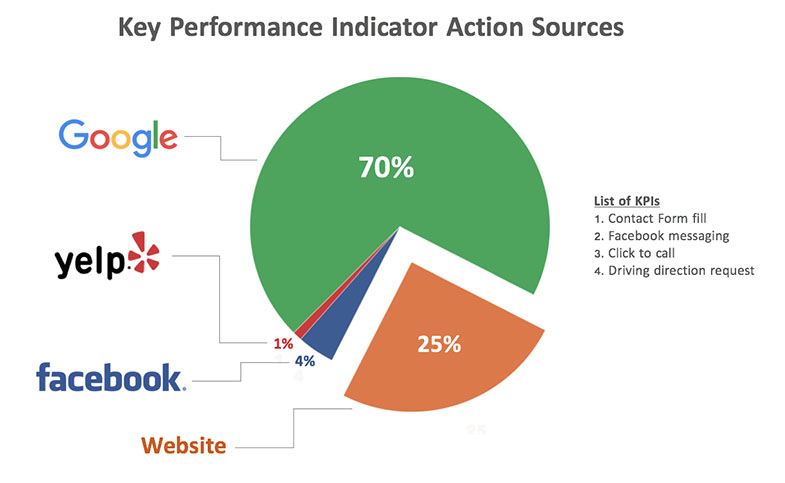
We were able to track roughly 360 actions across all platforms and the sources of these actions broke out like this:
Clearly the largest percentage of these KPIs occurred directly on Google either from the Knowledge Panel, the Pack results, the Local Finder or Maps. Typically in Barbara’s case, 70% of those come from search and 30% from Maps.
The website came in second. We have only done this study for one quarter and have no historical reference point. But my sense is that Google has, over the past two years, generally increased their share of these actions with changes to the Local search results. Due to issues with the WordPress theme not all instances of the phone number were tracked although most were.
Thus the website might be slightly under counted. Any conversions that came directly via an iPhone/Apple Maps would not have surfaced nor would have calls directly from iOS “direct answer” results and it is possible that iOS was undercounted as a result.
I was a little surprised that we found zero Bing actions according to their dashboard and our analytics. But such is the world of search.
It’s A Google World In Local
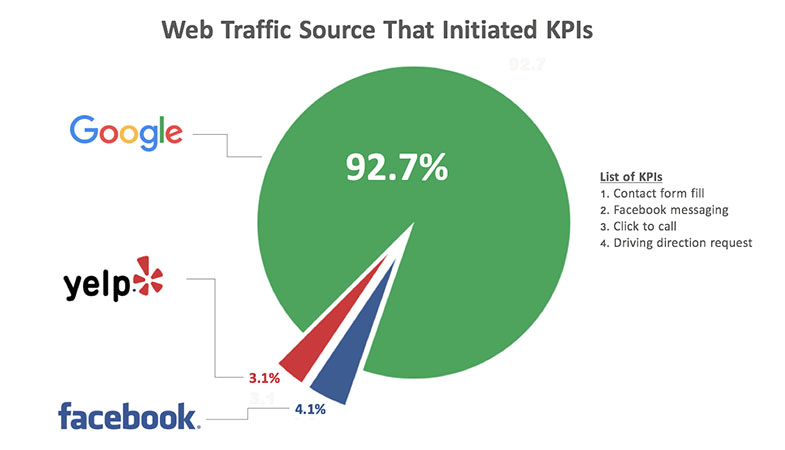
When we further looked into the web site traffic and its origination sources Facebook showed about a 3% increase in contribution. But most of the web traffic that initiated one of the KPI actions obviously came from Google.
In a very real sense, Google has become the equivalent of the new home page for the business. The bulk of direct pre-sale actions that benefitted the business were taking place there and the bulk of those that weren’t (ie web actions) came from Google.
While I don’t have the quantitative data to back this up, my sense is that Google is taking an increasing share directly compared to 4, 3 or even 2 years ago with various “updates” to the Local pack results.
Clearly there are some blind spots in our analysis but I think that they are directionally correct. And while it is only a case study, the methodology can be applied more broadly. It would be of interest to make the same analysis across different industries and markets to understand the amount of variation that we would find.
On a philosophical level the fact that more activity is taking place directly on Google is a disturbing trend, I for one do not want a web that is controlled at one end by Google and at the other by Facebook. As to what a business should or could do to avoid this is unclear.
For now if you need leads, you need to be present on Google.
That being said any given business really doesn’t care where the new customers come from as long as they come. The local business needs to be aware of the fact that many (actually most) of their new customers are coming from Google and has in place a plan to really treat both keyword and branded search results as their primary interface to the world, then they should get their fair share of new customers.
In this new reality your website is just a data source, one amongst many, that feeds the Google results.
Read part 2 to take a look at the in-store attribution and how that correlated with these measured KPIs.
* The KPIs chosen for any given local business will vary depending on the type of business and their goals. Obviously an emergency plumber would be more interested in phone calls and driving directions would be totally irrelevant. In that case call tracking might provide very meaningful metrics. A dance studio might be more interested in form fills for class sign ups. A dentist that has scheduling on their site might more interested in actual conversions to an appointment.
There are a ton of possibilities of KPIs that have strong consumer intent to purchase. From my point of view the closer the KPI is to the purchase the better and since so much activity isn’t taking place on your website, ones that are measurable at sites besides your website make sense. A local business, unlike an e-commerce play, doesn’t really care if the activity is at Google, Yelp or their website and given the realities of the digital world has very little to say about it anyway.


Comments are closed.