As consumers and business owners we want review ratings to reflect some objective reality.
We decided to analyze 2.25 million reviews across the top 18 review sites in our review monitoring services. We compared average ratings for any site for which we had a large enough corpus of reviews and business to get a meaningful average rating.
We found that the average rating varies widely. How could that be?
Average Review Rating Per Site
Like any single number used to represent a complex reality, ratings can sometimes seem surprisingly subjective. While they are not necessarily subjective they do reflect the bias and needs of the site on which they occur.
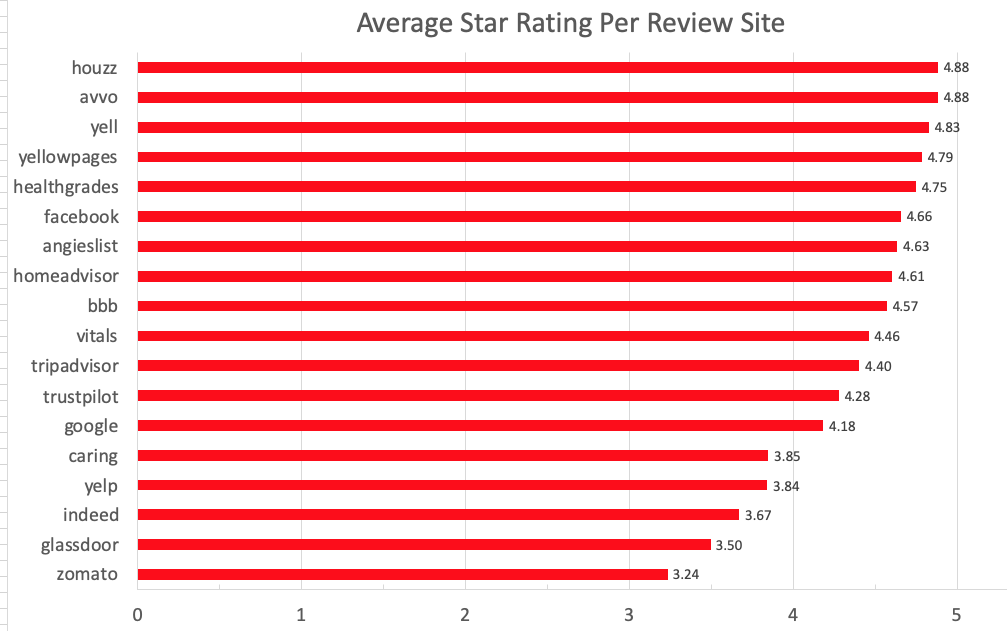
Why does Zomato show an average 3.24 rating while Yelp shows a 3.84, TripAdvisor carries a 4.4 average and Facebook (reviews pre Recommendations) comes in at a whopping 4.66?
How can you understand sites that largely reflect similar groups of businesses having quite different overall averages? Making sense of these numbers is largely a matter of understanding the decisions and to some extent the biases that went into calculating these ratings.
Numbers tend to seem objective. Yet even something like an average can be calculated in a number of different ways. It isn’t just limited to the most common averages like mean, mode and median average. When Google was using Bayesian averages to calculate star ratings a number of years ago it defied our common understanding of what we think a rating represents.
Statistical Choices
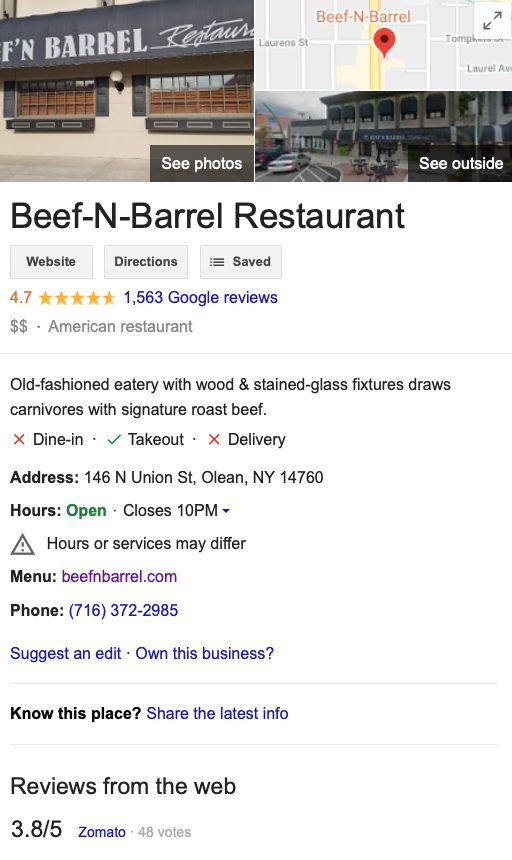
If you have previously seen and wondered about low Zomato ratings, they are good example of a ratings site that chooses a different type of statistical analysis to rate restaurants.
Rather than a standard 1-5 average, they grade every city’s restaurant on a curve. They “normalize” the values on a standard bell curve with 3 as the peak. And they do so on a per city basis. So, as you can see in the above chart, most locations hover around that middling value of 3 as defined by the use of the bell curve.
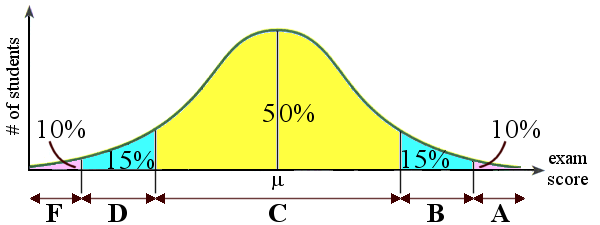
They claim that this allows users to understand relative ratings in any given market to better compare restaurants. That would be true if most users understood that Zomato was using a curve but most consumers probably do not understand that and are just left feeling confused.
Like you, I always hated being graded on a curve in school and I am sure that restaurants do as well as it often brings them in almost a full rating point below their Google average.
Review Site Bias
Like statistics, algorithms are thought to be bias free. They are not. They reflect the goals, needs and values of the site that creates them.
Yelp is a great example of this sort of algo based bias. Yelp really only wants long form reviews from dedicated Yelpers. They also want to keep out spam. But Yelp’s spam algo doesn’t just solve the spam problem it also keeps out reviews from the occasional reviewer and it filters significantly more positive reviews than negative ones.
In fact if you are an occasional reviewer that has a bone pick on Yelp, just write a very long, negative review and it will get published. Yelp filters far fewer negative reviews than positive ones.
You can see the effect of this on the rating distribution of reviews at Yelp compared to Google and the industry as a whole.
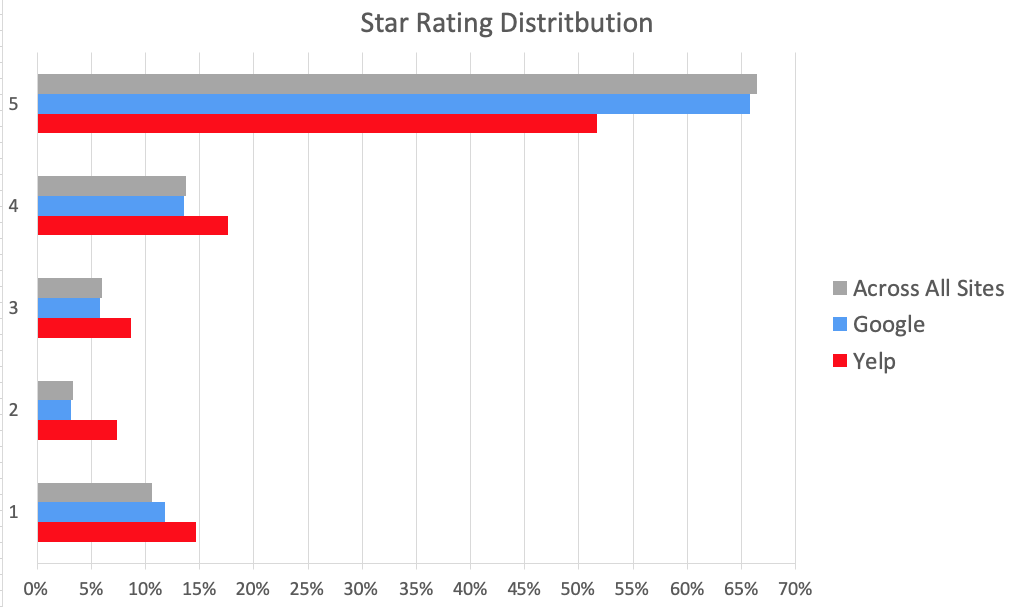
The effect of filtering mostly positive reviews shifts the average rating downward at Yelp and creates a more even distribution of reviews across the scale. This results in having many fewer 5-star rated businesses and effectively spreads out the curve with a similar outcome, although not as drastic, to Zomato.
Is it more objective? Hardly.
Consumer Bias
The chart above shows another bias, that of the consumer. There are significantly fewer 2 and 3 star reviews across the industry than of 1, 4 or 5 star reviews.
Consumers that post to review sites tend to either be very negative or positive. They tend to only post at the extremes of the rating system. Either they are happy or upset and share their middle of the road experiences much less often.
This jives very closely with our previous consumer survey which showed that most users wanted to only share their positive experiences.
What Does It Mean For Your Business?
The good news is that on average 66% reviews are 5 star reviews and if you include 4 star reviews, 80% of the reviews are positive on average. Even at Yelp 70% of the reviews are either 4 or 5 Star reviews.
It would seem from this data, and I am not quite sure why, vertically oriented sites tend to be more positive and probably should be considered as places to get the occasional review to fill out your general review visibility.
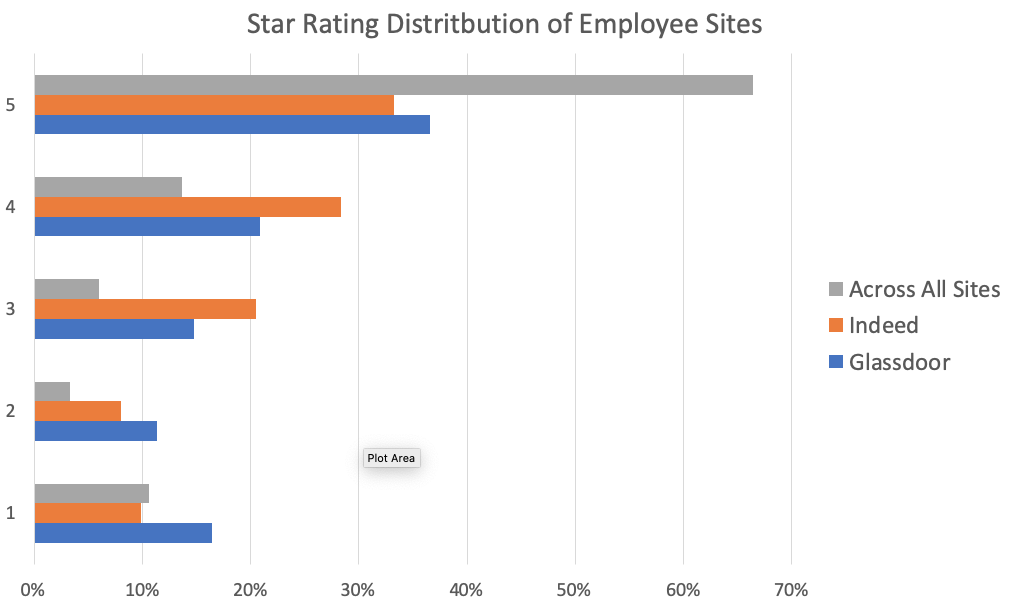
And, you should not neglect, at a minimum, monitoring the employee sites like Indeed and Glassdoor. Ex-employees are a difficult lot to keep happy but reviews at those sites can still impact the overall perception of your brand.
Using Reviews For Improvement
Mark Twain popularized the saying “Lies, damned lies and statistics” to describe the persuasive power of numbers, particularly the use of statistics to bolster weak arguments. When viewing review ratings one could easily succumb to the pessimistic belief that ratings are just another use of a number that bolsters a weak argument or helps a website sell their point of view.
While ratings do reflect many biases, if you understand the source of the calculations and inputs then they can once again take on meaning. And with some work, take on increased value.
GatherUp has long been an advocate to not just use reviews for ranking or even just for marketing but to use them to better manage your business and to identify specific areas for improvement.
Asking for and getting your own reviews and feedback is one of the best ways to overcome the vagaries of the review sites and consumers. Your own reviews when combined with your third party reviews will tend to remove some of the biases mentioned above, provide a broader range of consumer sentiment and increase the sample size.
All of which will help you develop a greater understanding of your business. A clearer picture of your strengths and weaknesses can emerge and can be used to help you earn even better ratings in the future.