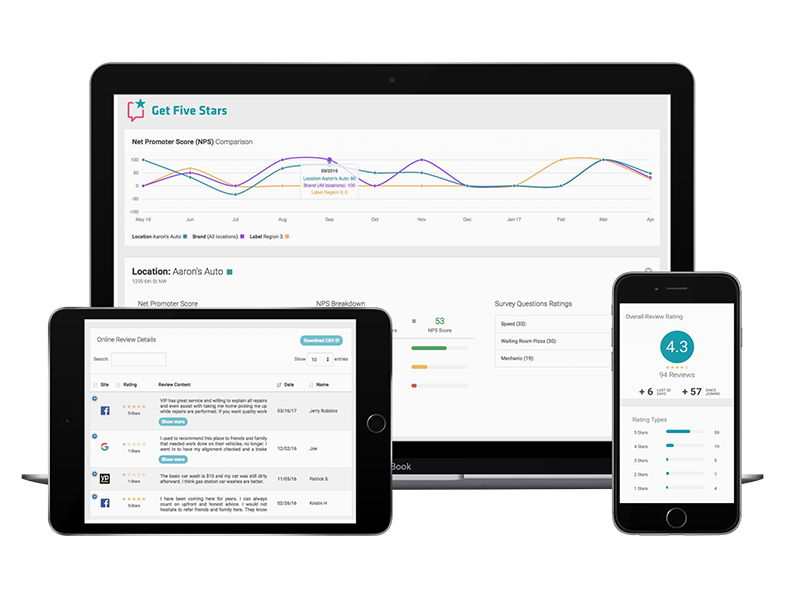
The GetFiveStars team is very excited to announce the launch of our new reporting engine and reports today. Our new reports have been redesigned focusing on strong visuals, new charting, increased data delivery and more features to customize your views.
In addition to this post that shares some screen shots and details you can learn more by watching our April webinar or by visiting our User Guide section on reports.
Let’s take a quick look at each of the new reports and I’ll highlight some of the areas of interest.
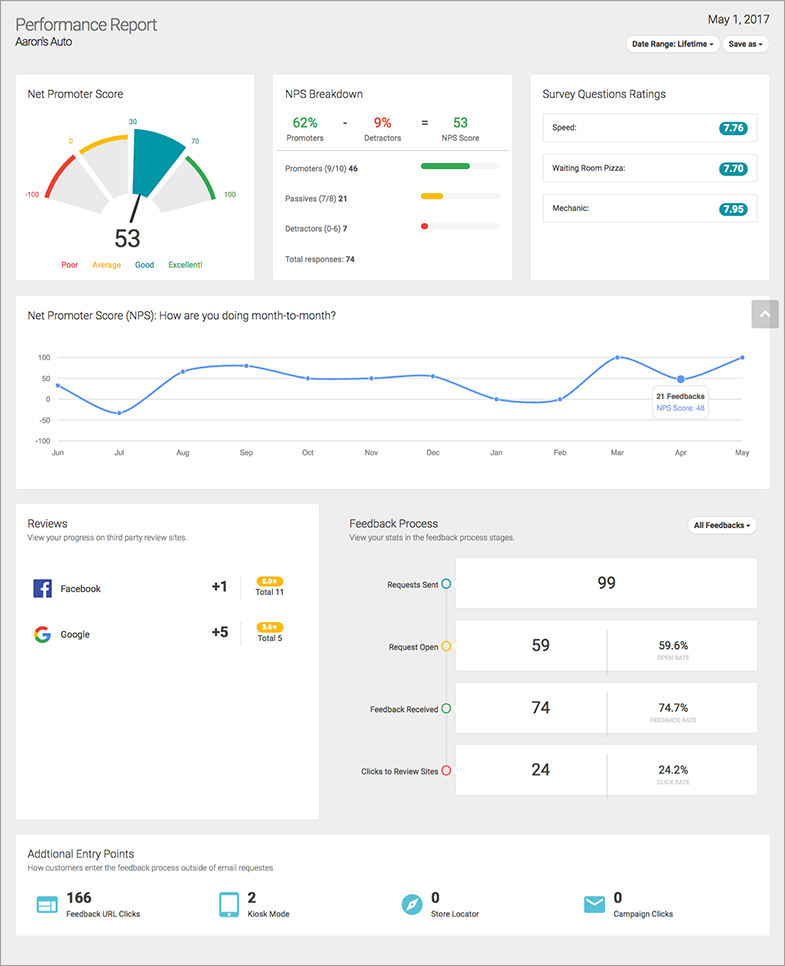
Performance Report
The Performance report has always existed but it’s fully redesigned and loaded with more data. This report gives you a snapshot of your performance for each location. It pulls data from all of the various reports and data points to give you an executive summary. The report can be automatically emailed to anyone on a weekly or monthly basis in addition to being accessed at anytime in the platform.
A few of the new feature and data additions to this report are:
- Addition of custom date ranges
- Net Promoter Score ratings by category with NPS formula
- Survey question ratings added (used to be only available in Customer Level Reports)
- NPS score by month in a visual chart display
- We have added reviews by specific site, total review rating, total reviews and reviews since starting GFS
- Visual Feedback Process funnel with percentages added for open rate, feedback rate and click to review sites rate (can segment by email, SMS or both)
- Additional entry points now include Kiosk mode and Store Locator
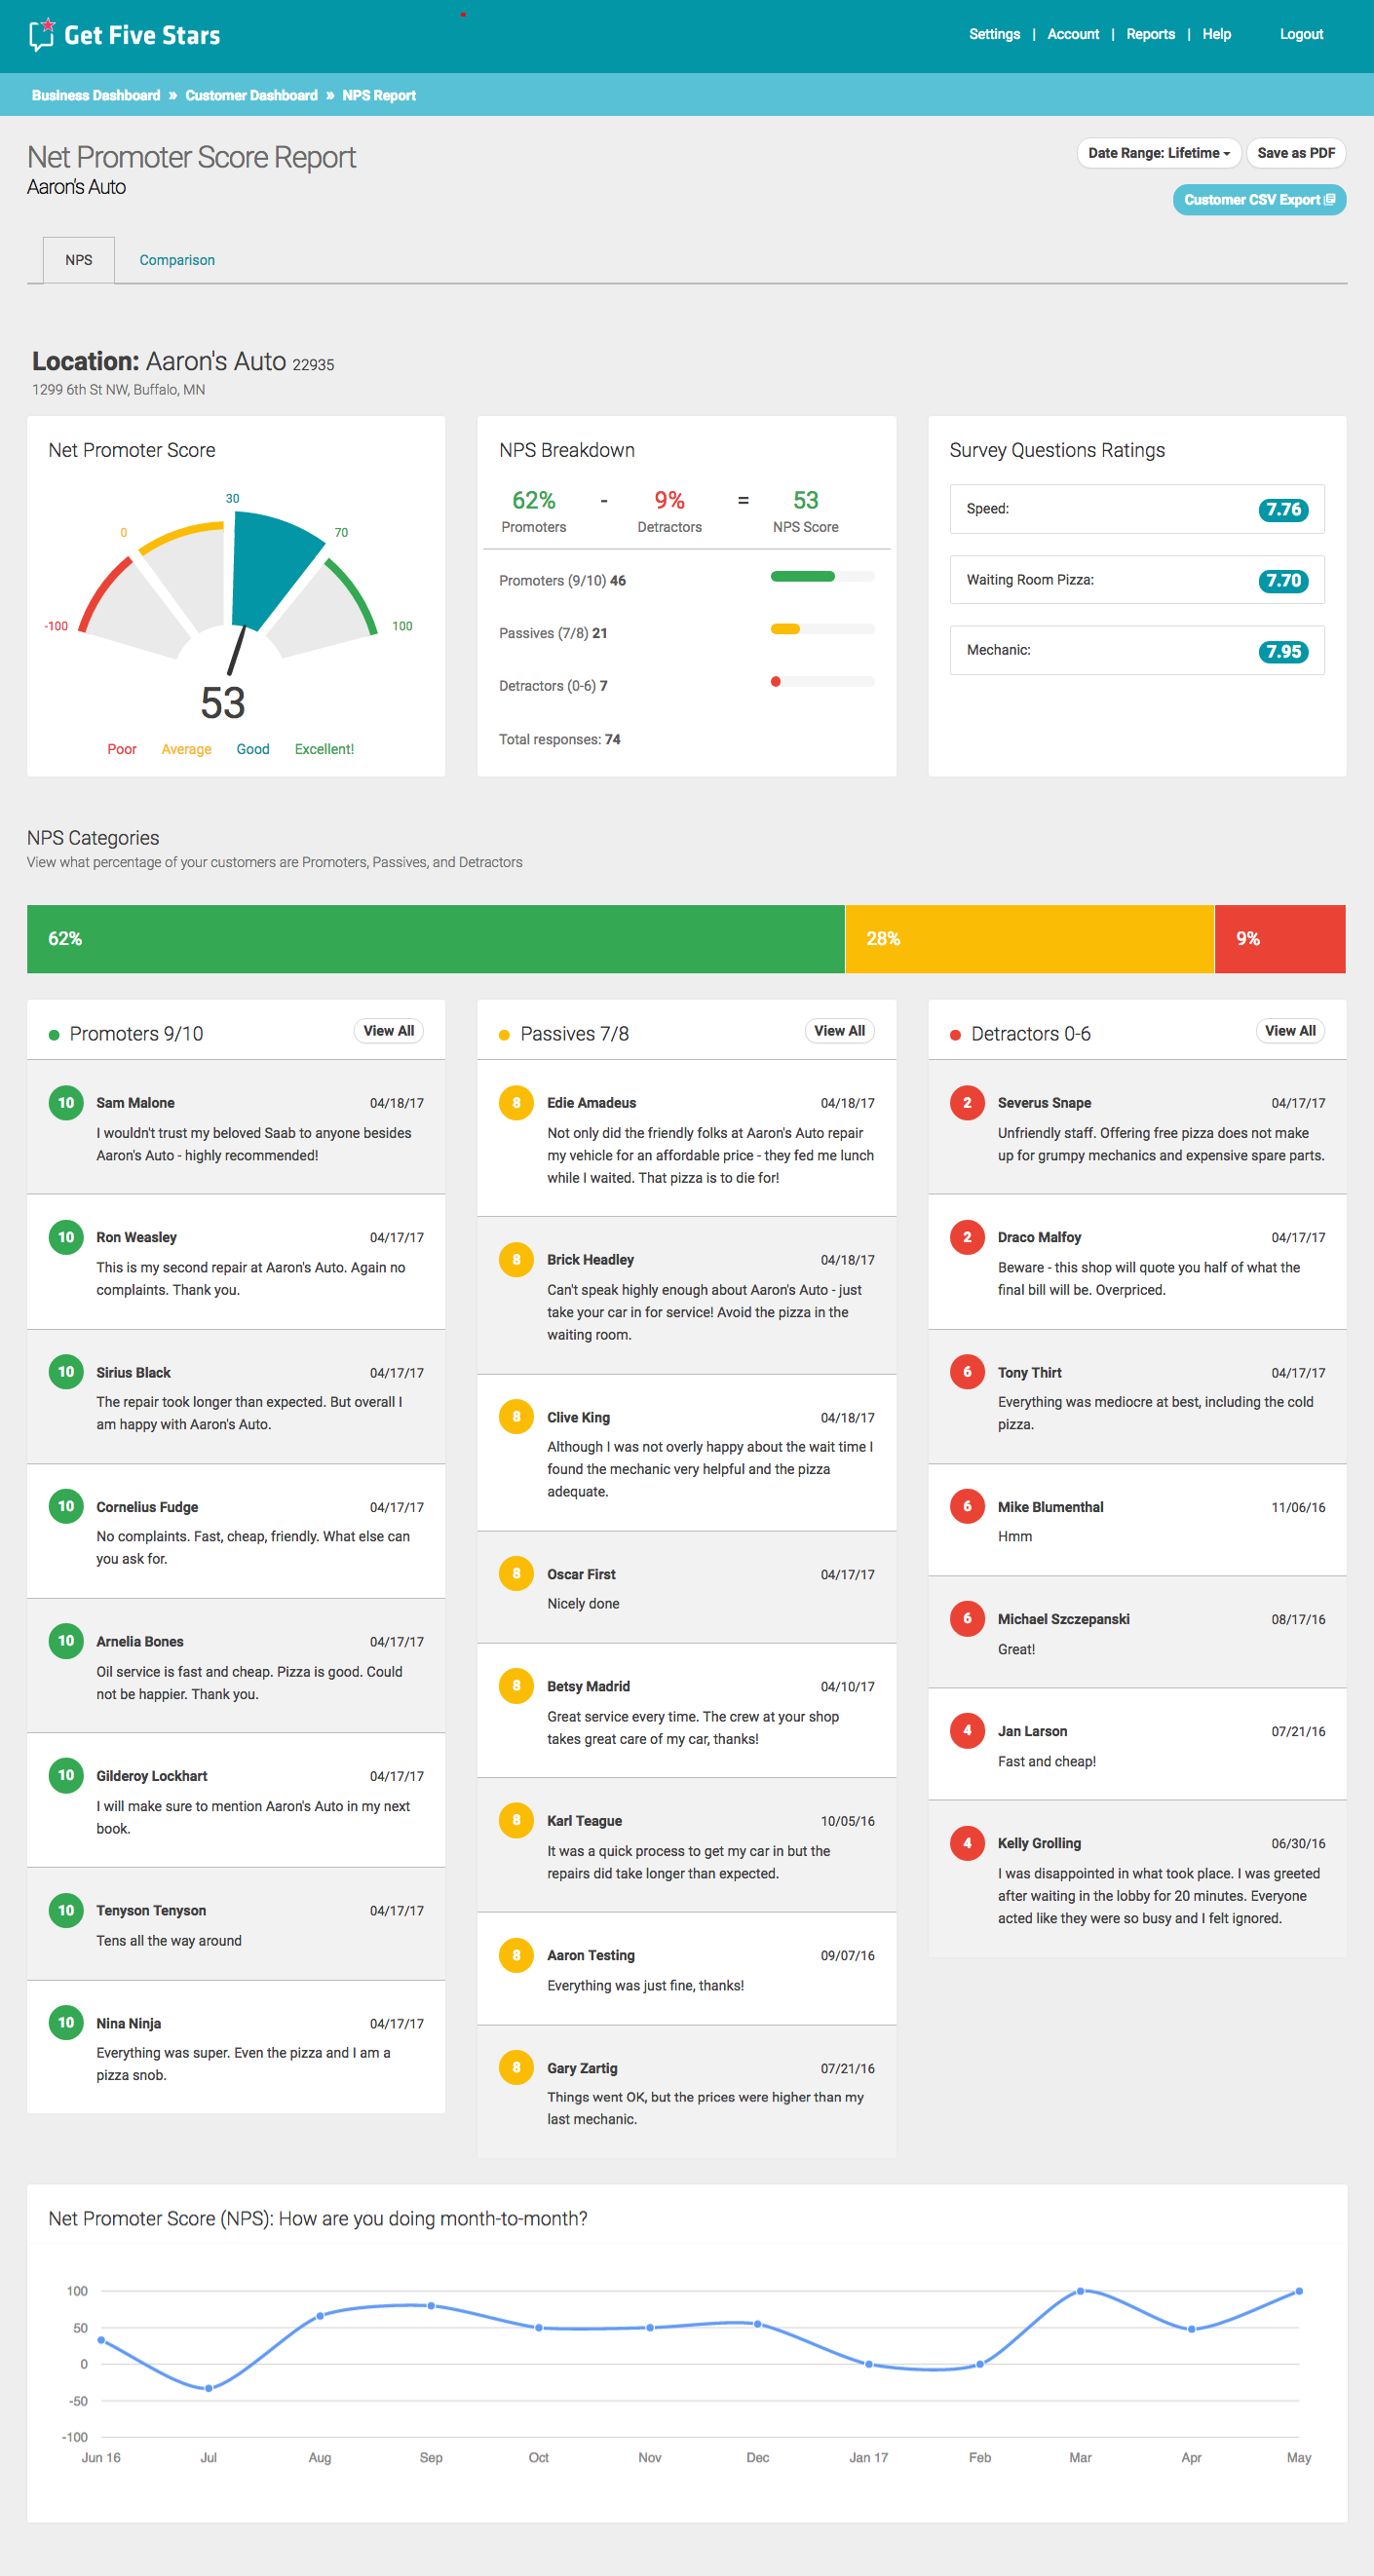
Net Promoter Score Report – NPS Tab
This is a brand new report designed to help you better understand your NPS rating and your customer’s sentiment and comments. The report helps break down your customers by NPS category and will be expanded in the coming months with more data.
Important features of this report:
- Date range choices as well as custom date range selection
- Ability to save/print the report as a PDF
- The former Customer Level Report is now downloadable from this report/screen via a CSV file
- NPS breakdown by Promoters, Passives and Detractors with NPS formula
- Survey question ratings
- Columns of each NPS category and up to the last 10 customers/ratings in each category
- “View All” button to quickly take you to Customer Dashboard with the filter applied for that category to enable view of just promoters, just passives or just detractors
- Month to month NPS charting
Net Promoter Score Report – Comparison Tab
This is an extension of the NPS report designed to help you compare date range performance of your location, different locations versus each other, labels, and brand averages. Each element is represented by a data card with that element’s performance and up to six data cards can be compared at one time.
Important features of this report:
- Date range choices as well as custom date range selection
- Visual charting is produced after you select more than the current element you are in, you can also delete any element, including the location you are in.
- Single location: ability to compare one date range of your data vs. another date range
- Multi-locations: ability to compare locations versus each other
- Multi-locations: ability to compare locations vs. labels or even labels vs. labels
- Multi-locations: ability to compare locations or labels versus brand (overall)
- You can do any combination of the above (example: date range vs. location vs. label vs. brand)
- Ability to use ORDER BY that will order the data cards by what specific data point you have selected. Select Promoters and it will order them by who has the highest to lowest amount of promoters.
- ORDER BY offers ordering by NPS score, Responses, Promoters, Passives, Detractors and each individual survey question. It will also change visual charting to that data.
- Ability to save/print to PDF
- Report Template. Once you select a specific set of elements to report on you can then SAVE those elements into a “template” you can access in the future with one click. So if you are comparing 3 different date ranges of one location together, you can save it to reuse in the future.
- Report templates you create are yours only unless you check GLOBAL, then anyone with access to the account can select and view that report template
Reviews Report – Reviews Tab
This report is a completely overhauled version of our former Review Monitoring Report. It includes many helpful data points on your online reviews including sources, types, average rating, review growth. It also displays the individual reviews and their content.
Important features of this report:
- Now has the ability for date ranges including custom date range
- You can save/print a PDF of the Reviews report
- Displays overall review rating for sites that are being monitored
- Displays total review count of monitored sites, new reviews in last 30 days and new reviews since starting to use GFS (we capture all reviews from monitored sites when you start)
- Rating types by star level (1-5 stars)
- Reviews and rating average per review source
- Month to month chart of review rating average and count
- Details of each review detected on monitored sites
- Ability to sort reviews in ascending or descending order based on review site, rating, date or name
- You can download a CSV file of all review data
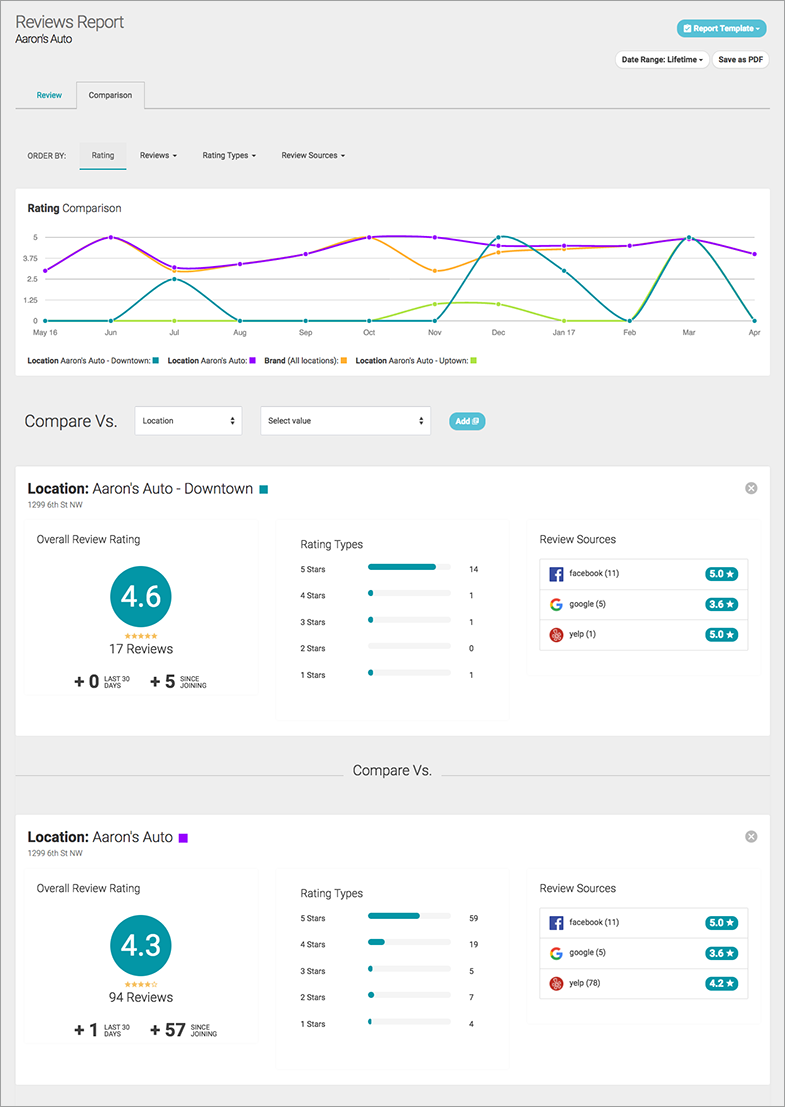
Reviews Report – Comparisons Tab
This is a brand new report feature designed to help you compare different online review elements of your location and account. Each element is represented by a data card with that element’s performance giving you many options in comparing up to six data cards at one time.
Important features of this report:
- Date range choices as well as custom date range selection
- Visual charting is produced after you select more than the current element you are in, you can also delete any element, including the location you are in.
- Single location: ability to compare one date range of your data vs. another date range
- Multi-locations: ability to compare locations versus each other
- Multi-locations: ability to compare locations vs. labels or even labels vs. labels
- Multi-locations: ability to compare locations or labels versus brand (overall)
- You can do any combination of the above (example: date range vs. location vs. label vs. brand)
- Ability to use ORDER BY that will order the data cards by what specific data point you have selected. Select “Rating Types > 4-stars” and it will order them by who has the highest to lowest amount of 4-star reviews.
- ORDER BY offers ordering by overall rating, reviews in last 30 days, reviews since starting GFS, rating type (1-5 stars), reviews sources (Google, Facebook, YP, etc.)
- Changing the ORDER BY will also change the chart that is appearing to the data you have focused on with the ORDER BY selection. Color coded cues.
- Ability to save/print to PDF
- Report Template. Once you select a specific set of elements to report on you can then SAVE those elements into a “template” you can access in the future with one click. So if you are comparing 3 different date ranges of one location together, you can save it to reuse in the future.
Business Report
This report is an update to our former Business Level Reporting, bringing that raw data into a visual, sortable format. Single locations can view a row of valuable data across the location’s performance. Multi-locations will benefit from the ability to sort out what locations are performing best in each column like NPS, Feedback Rate and New Reviews.
Important features of this report:
- The current “Business Level Report” is still available on this page by clicking the Download CSV file
- Ability to sort each data column in ascending or descending order
- Ability for multi-locations to only display specific label(s) in the report
- Date range selection including custom date range
- Save/print as PDF
- New column added for Feedback rate
- Keyword search
Created For You
Many customer comments and requests were at the heart of this huge update to our reports. We are so excited to bring you this new reporting engine to help you do even more with what GetFiveStars offers. Please let us know your thoughts on the new reports and any additional suggestions you have. We always listen.