The release of our new reporting engine has really created some fantastic opportunities to benefit from the data we collect and display.
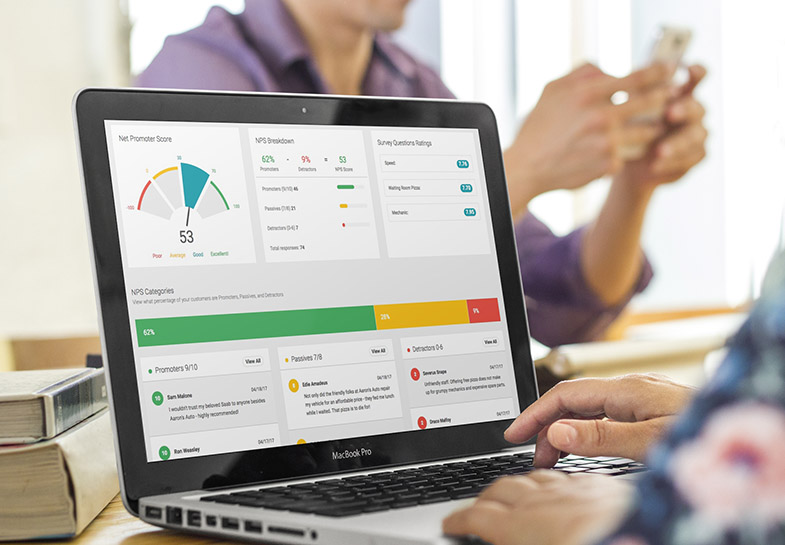
One of the big additions to reporting is the comparison feature you’ll find in the Net Promoter Score Report and the Review Report. A few single location businesses have asked how they can leverage this feature so I wanted to share a couple of ways you can get some great custom reports using comparisons.
These two reports serve as great ways to compile data into bigger sets, benchmark where you are at and track improvement for yourself or with your team.
Quarterly Net Promoter Score Report
If you are a single location on our platform or if you just really focus on one location, even if you are part of many locations, this is a great way to identify your NPS progress. Creating a report that allows you to look at your NPS (and survey question results) in a quarter by quarter basis will give you more compiled data and a better sense of averages than just month by month.
Step 1 – Go to the new NPS Report under ‘Reports’
Step 2 – Click on the ‘Comparison’ tab
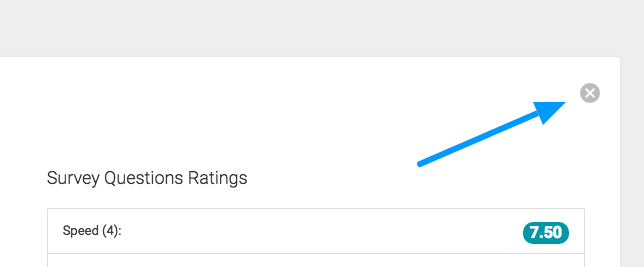
Step 3 – Delete the default location data card showing by clicking the grey X in the upper right
Step 4 – On the Compare Vs. selection, choose “Date range of this location”
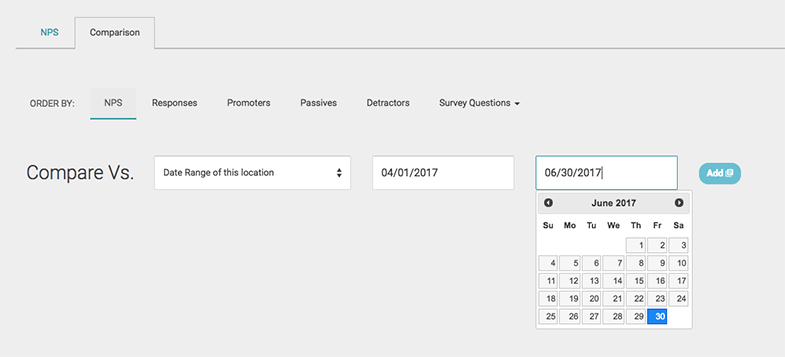
If you have just started with us, create your first date range to be the quarter you started in. So if you just started in April 2017, you would choose April 1st as the start date and then June 30th as the end date. Then click “Add”. You have just created a data card for the 2nd Quarter of 2017.
Next you would add comparisons for each of the future quarter dates. You can add up to 6 comparisons in our reports so you can build this report to work for the next year and a half. This sets the framework for this report and as time goes buy new data will roll in for each quarter to display in the appropriate data card.
If you have been using GetFiveStars for a while, lets say since the start of 2016, you can choose to go back and add date ranges from each quarter in 2016 to view the history and compare how you have done each quarter.
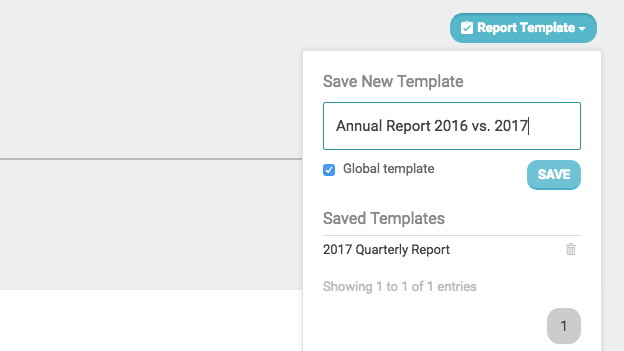
Step 5 – Once you have created each quarter in your report to compare, you want to SAVE this report for future use. Click the “Report Template” button, label your report something like “2017 Quarterly Report”.
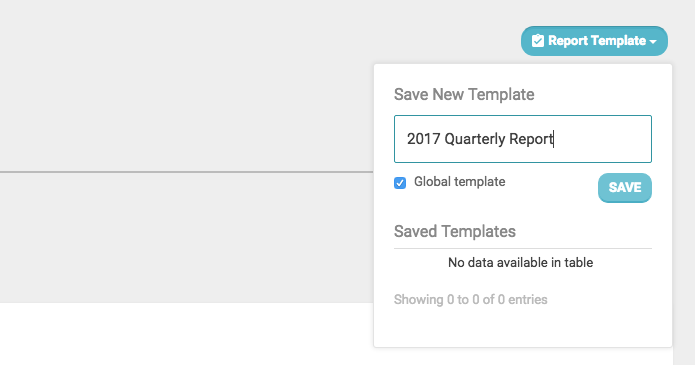
The next time you return to the NPS Comparison report and click the Report Template button you can select this report and it will populate all of your data cards and date ranges.
Tip: As you go along over time you can always use this report to compare 6 quarters at one time. You can easily delete the oldest quarter from the report and and the current or future one.
Annual Net Promoter Score Report
If you want to take an even broader view of your NPS and survey question averages you can set-up an annual report using the same steps as above. This annual report is great for businesses that have been on GetFiveStars for well over a year or more.
Repeat the same steps above, but when you get to step 4 you will want to enter in a date range a year at at time. A simple example would be to create one comparison for January 1st, 2016 through December 31st, 2016. Then create a 2nd comparison for January 2017 through December 2017.
Go to step 5 and save this report as your Annual Report 2016 vs. 2017 and you have a simple and helpful report to analyze NPS performance comparing one year versus another.
Bonus: The report templates are saved in the system so you can use them with the Review Reports once you have set them up as well.
Go create these reports to view your past performance or set-up the ease of having these ready in your future. If you have other reports you are creating or ideas, we would love to hear from you.